
The "$140,000 poverty line" is very silly
People love to say that the American middle class is poor. But it's not.

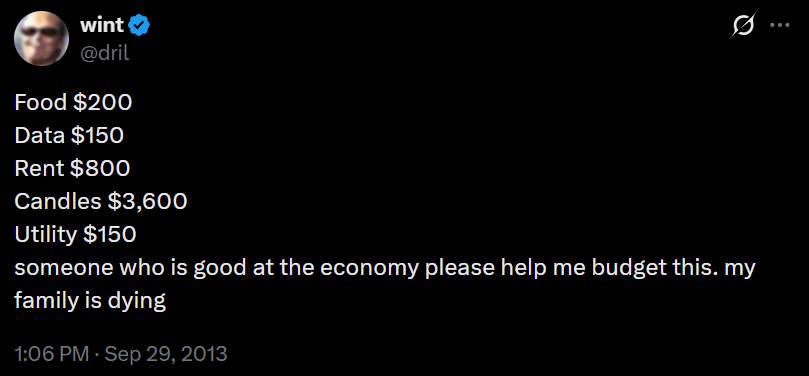
Every year or so, there’s a new crop of articles about how you need to make $350k a year to live in New York City, or $150k is lower middle class, or you need $300k to be middle class, or why people making $400k are barely scraping by. This article is always roundly ridiculed on social media, and a few days later someone writes a post going through the numbers and debunking the whole thing. And then everyone posts the famous tweet:
There’s just something very annoying about publications that cater to upper-class audiences trying to reassure those audiences that they’re actually struggling.
In a recent post on his Substack — followed by a shorter version in The Free Press — asset manager Mike Green made a similar claim, but got much more positive attention for it. Instead of claiming that a family that makes $400,000 is middle class, he claimed that a family making less than $140,000 is poor. This is from the Free Press version:
I realized that [the U.S. official poverty line]—created more than 60 years ago, with good intentions—was a lie…“The U.S. poverty line is calculated as three times the cost of a minimum food diet in 1963, adjusted for inflation.”…[W]hen you understand that number, you will understand the rage of Americans who have been told that their lives have been getting better when they are barely able to stay afloat…
[E]verything changed between 1963 and 2024. Housing costs exploded. Healthcare became the largest household expense for many families. Employer coverage shrank while deductibles grew. Childcare became a market, and that market became ruinously expensive. College went from affordable to crippling…A second income became mandatory…But a second income meant childcare became mandatory…two cars became mandatory…In 2024, food-at-home is no longer 33 percent of household spending. For most families, it’s 5 to 7 percent. Housing now consumes 35 to 45 percent. Healthcare takes 15 to 25 percent. Childcare, for families with young children, can eat 20 to 40 percent.
If you keep [the original] logic [of the poverty threshold]—if you maintain [the] principle that poverty could be defined by the inverse of food’s budget share—but update the food share to reflect today’s reality, the multiplier is no longer three.
It becomes 16. Which means…the threshold for a family of four—the official poverty line in 2024—wouldn’t be $31,200. If the crisis threshold—the floor below which families cannot function—is honestly updated to current spending patterns, it lands at close to $140,000.
And just to double-check this number, Green does a quick calculation of what a family of four would need in order to afford the necessities of modern life, and comes up with a similar number:
I wanted to see what would happen if I ignored the official stats and simply calculated the cost of existing. I built a basic needs budget for a family of four (two earners, two kids). No vacations, no Netflix, no luxury. Just the “participation tickets” required to hold a job and raise kids in 2024. Using conservative data for a family in New Jersey:
Childcare: $32,773
Housing: $23,267
Food: $14,717
Transportation: $14,828
Healthcare: $10,567
Other essentials: $21,857
Required net income: $118,009
Add federal, state, and FICA taxes of roughly $18,500, and you arrive at a required gross income of $136,500.
Wow! Two different methodologies, but the same conclusion: the cost of merely participating in the modern economy, for a family of four, is around $140,000. If your family makes less than that, you must be poor.
This post made the rounds like wildfire, and was generally well-received. It turns out that there’s a much bigger market for the idea that $140,000 is poor than there is for the idea that $400,000 is middle-class.
But despite its popularity, Green’s claim is wrong. Not just slightly wrong or technically wrong, but just totally off-base and out of touch with reality. In fact, it’s so wrong that I’m willing to call it “very silly”. I know Mike Green, and I count him as a friend, but we all write silly things once in a while,1 and when we do, we deserve to be called out on it.
Why is the $140,000 poverty line silly? Well, there are two main reasons. First, Mike actually just gets a lot of his numbers wrong when he makes his calculations. And second, the way Mike is defining “poverty” doesn’t make any sense.
I’ll go through both of those points, but first, let’s step back a second and talk about why the claim that $140,000 should immediately strike you as highly suspicious.
The whole thing doesn’t pass the smell test
In economic policy debates, it’s important to be able to sniff out claims that aren’t going to hold up. I’m not saying that “extraordinary claims require extraordinary evidence”, as Carl Sagan said. I’m saying that when you see a claim that sounds way off, there often isn’t any good evidence for it at all.
If Mike is right, most Americans are poor people. The majority of American families make less than $140k a year. Median family income for a family of 4 in the United States is $125,700. That means that the majority of 4-person families make less than that. So if Mike Green is right, that means that more than half of American families are poor — or at least, more than half of 4-person families.
When Mike says “poor”, he means that people can’t afford what he calls a “participation ticket” — a basket of basic necessities. He names the things in that basket: rent, health insurance, transportation (including two cars), “other necessities”, and child care. If he’s right, then more than half of American families lack one or more of the basic necessities of life.
Is that true? Well, we can check these necessities one by one. Let’s start with food. For caloric consumption, we can’t really find a median (most people don’t count calories so you can’t do surveys), but we can find an average. And average calories per person has gone way up over time:
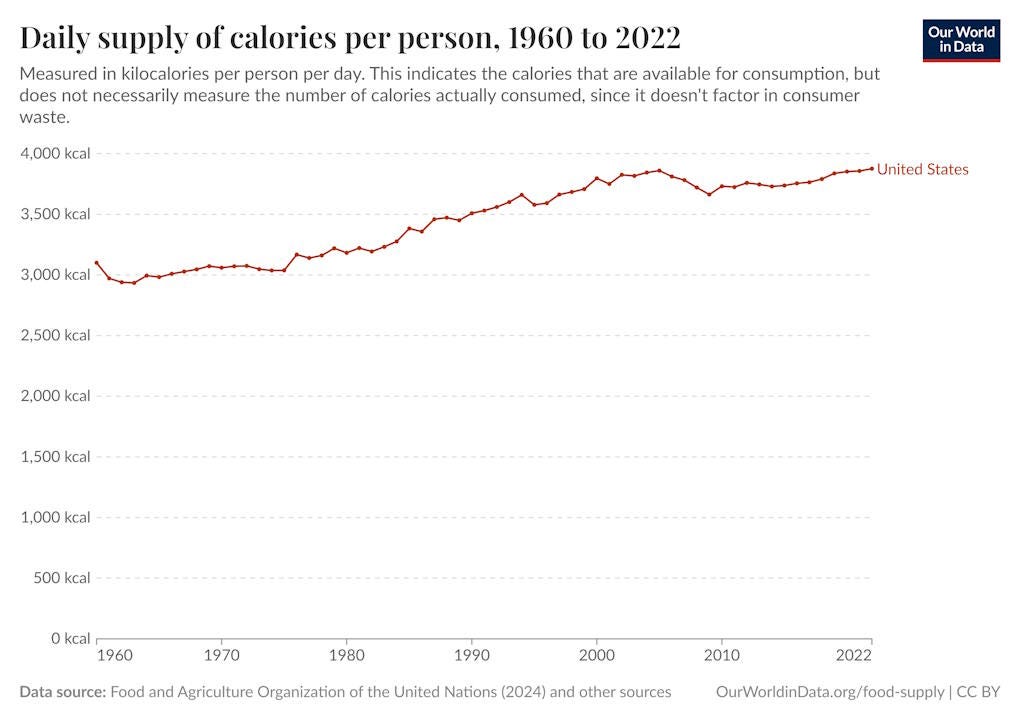
The distribution of how much food people eat probably isn’t very skewed (there isn’t one guy eating a billion calories…I hope!), so this means the typical American is eating a lot of food. In fact, of all the countries on the planet, only Irish people eat more calories than Americans. As for food insecurity, America has a lower share than practically any other country on Earth, including Scandinavia:
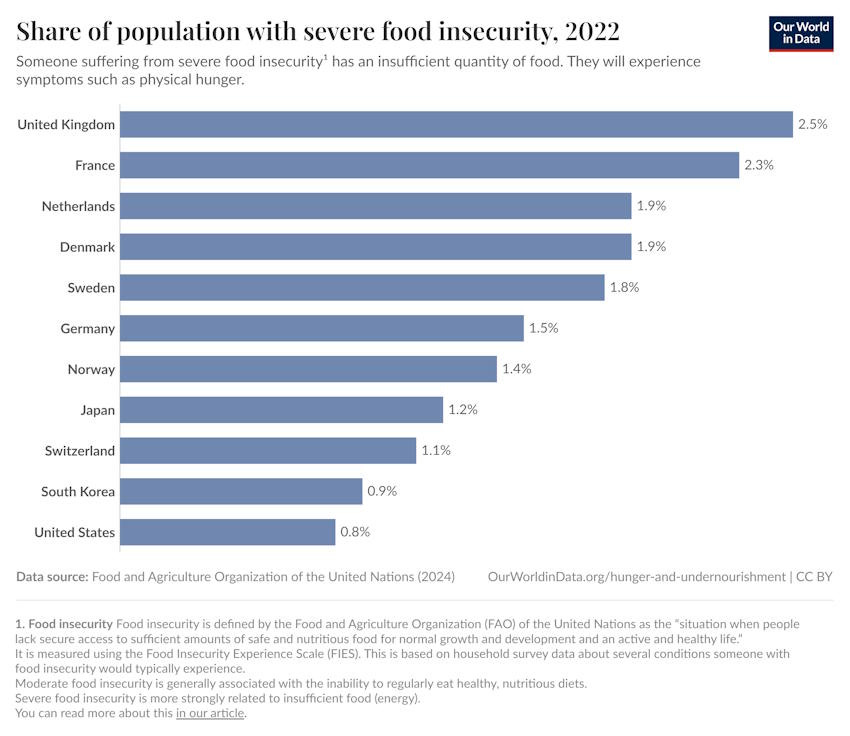
That’s severe food insecurity; about 10% of married-couple households report some level of food insecurity. So almost all American parents are putting food on the table for their families.
How about shelter? About 14% of American children have living situations with more than one person per room, which is how we define “overcrowded”.
We can also look at floor space. For 4-person households, total floor space per capita was 524 square feet in 2020 (it’s much higher for smaller households). In 1960, average floor space per person across all households was only 435 square feet for newly built homes. The average for 4-person families across all homes would have been a lot smaller than that, since it includes all the older homes from previous years that were much smaller.
So we’ve definitely seen a very big increase in how much space American families have to live in, over time. Also, for what it’s worth, Americans have more living space than people in almost any other country. In sum, most Americans are doing fine in terms of shelter and living space.
How about health insurance? Here we have some very good news: The total percent of uninsured Americans has fallen to only 8%.
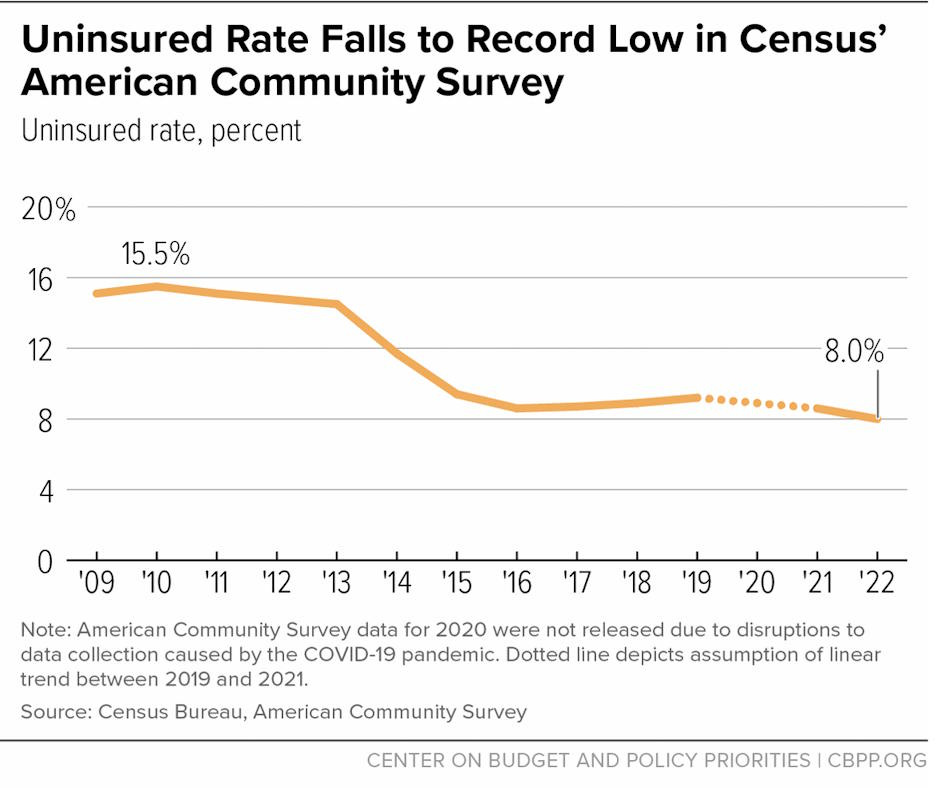
And in fact, the news gets better! According to the CDC, only 5.1% of American children were uninsured as of 2023. So at this point, almost all Americans in 4-person families are going to have health insurance.
(Thanks, Obama!)
What about transportation? Here’s a chart I found for the number of vehicles for 4-person households in 2022:
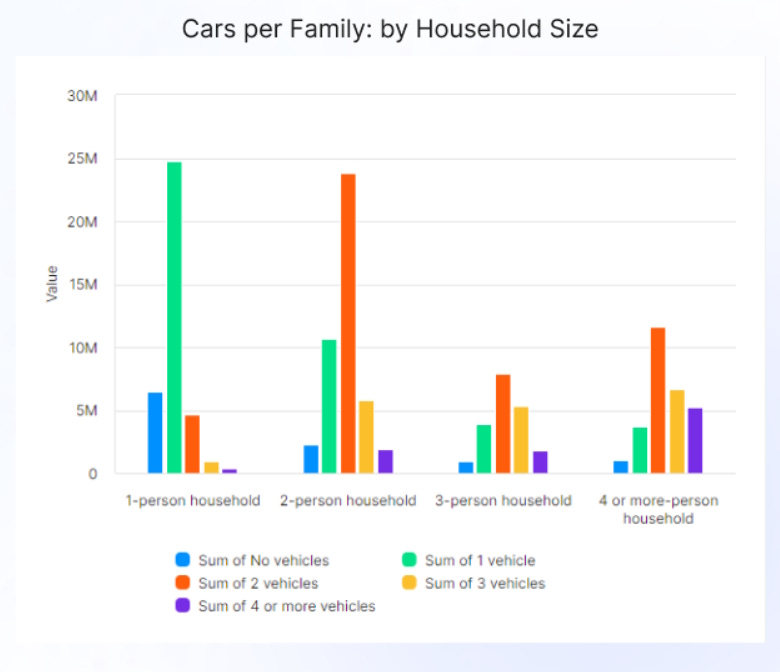
According to this data, more than 80% of America’s 4-person households have 2 or more cars. Presumably some fraction of those households have single breadwinners, and thus — by Mike Green’s reckoning — don’t necessarily need two cars, while a few live in places with good public transit. So most Americans do have adequate transportation.
As for child care, I don’t have good numbers on how many Americans have it (since it comes in many forms). But as Mike says, child care is something you get so that you can have both parents go work; ultimately, it’s not something you need in and of itself in order to live a good life. So we can omit it from this list.
The basic point here is that:
Most Americans have plenty of food to eat
Most Americans have a comfortable amount of living space
Most Americans have health insurance
Most Americans have sufficient transportation
By itself, that doesn’t prove that most Americans have all of these things. It’s possible that each family has to choose one or two of these to give up, and that they make different choices. So maybe you take the 10% of 4-person families who are food insecure at some point, add the 8% who lack health insurance, then add the 16% who have less than two cars, and add the 14% who have overcrowded living situations, and you get…48%! So it’s possible half of Americans lack at least one of the basic necessities of life…right?
Well, no, because there’s going to be lots of overlap between those groups. A lot of the people who don’t have enough to eat are going to be the same people who have only one car, a family member without health insurance, and a cramped living space. In reality, you can’t just add those percentages up — the percent of Americans who lack even one of the basic necessities Mike Green lists is going to be a lot less than half. It’s probably going to be closer to the 25.5% of Americans who live in “relative poverty” (below 60% of median income). That’s higher than the official poverty rate, but not even close to Mike Green’s number.
In other words, the whole idea that more than half of Americans are poor doesn’t fit with anything we know about the lifestyles that typical Americans actually live. That’s why our intuition should be sounding the alarm like crazy when we read a line like “the real poverty line is $140,000”. We’re not talking about aliens from Mars here. Most of us either are middle class, or know people who are, and they don’t lack the basic necessities of life. They aren’t missing their “participation tickets”.
So how did Mike get this so wrong? It turns out there are two reasons. First, he used some bad numbers to make his calculations — so even on his own terms, the $140,000 number is bad. But also, the way he goes about calculating the price of a “participation ticket” in the American economy just doesn’t make sense.
Green gets his own numbers completely wrong
How does Mike get his $140,000 number for the poverty line? He starts with the way they came up with the official poverty line back in 1963:
First, they observed that in 1955, the typical household spent about 1/3 of its after-tax income on food.
Then, they calculated the cost of the minimum amount of food you’d need to live.
Then, they multiplied by 3, figuring that that was the amount of money you’d need to live overall, if you spent a third of your income buying food.
OK, so what does Mike Green do? He notes that people spend a lot less of their income on food today than they did back in 1955. Instead, he finds that they spend only 7% of their income on food. So he figures that the cost of living must now be around 14 times the cost of food, instead of 3 times. So he multiplies today’s official poverty measure — still defined just as it was in 1963 — by 14/3, and comes up with somewhere around $140,000. (He says he used 16 instead of 14, which I think is a tax adjustment, but might be a typo.)
But here’s the problem: Mike uses the wrong number for the percent of income spent on food! The 7% number is the percent of income spent on food at home. The food numbers for 1955, which were used to create the original poverty measure, included money spent at restaurants. But read the fine print, and you’ll see that Mike’s number leaves out restaurants:
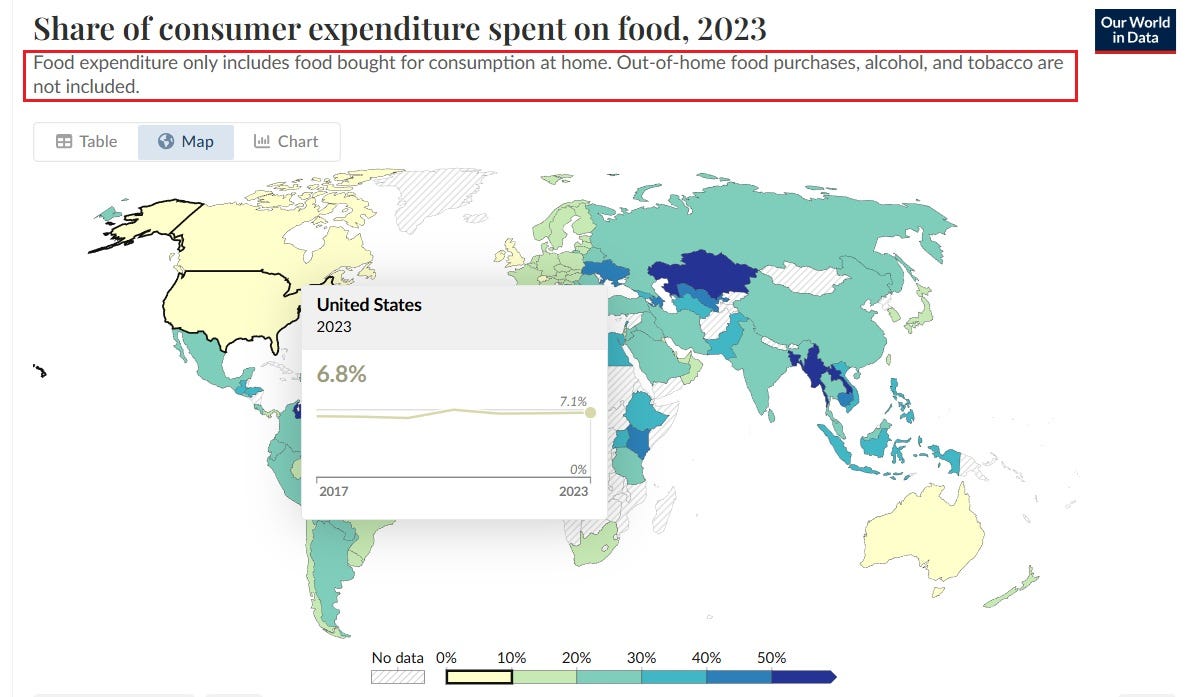
OK so how much do Americans spend on food total? I found two slightly different numbers — the BLS says 12.9%, and the USDA says 11.2%. But also, the share is a lot less constant across income groups than it was back in 1955. Here are the USDA’s numbers:

Anyway, let’s use 12.9%, the BLS’s number, which looks similar to the middle income quintile number from the USDA. That’s about 1/7.75. So using Mike Green’s method, we can multiply the official poverty line ($31,200) by 7.75/3, which gives us about $80,000.
That’s not necessarily a number that makes sense either — in the next section, I’ll explain why Mike’s whole approach is not a good way to calculate poverty. But a simple error made Mike’s own calculation off by almost a factor of 2. Before you go announcing that our poverty numbers are all a lie, you should probably check your numbers. Mike is a professional asset manager, so I’m sure he’s used to having to check through macro data; this is also important when blogging.
Note: It was Scott Winship who alerted me to this problem with Mike Green’s data:

Meanwhile, Jeremy Horpedahl has a great post exposing problems with some other numbers that Mike uses. For example, Mike often says that the median income in America is only around $80,000 — a fact that he uses to argue that most Americans are way below his “poverty line”. But Horpedahl points out that this is median household income. Lots of households are just one person living alone. But all of Green’s calculations are for a family of four. The median family income is actually $105,800, as Horpedahl points out. But the median family income for a family of four, which is the example Mike talks about, is actually $125,700.
In other words, American families actually make a lot more money than Mike claims. This is another simple error; if you talk about a family of four, you should compare that to the actual income that a family of four makes, not to an income number that includes 22-year-olds living with roommates.
So even if you accept Mike’s definition of poverty, he just uses the wrong numbers. If you use the right data for food expenditure and the right data for median family income, Mike’s own methodology gives us a “poverty line” that’s about 64% of the median income — not too far off from the common definition of “relative poverty” as 60% of median income.
Mike also makes a major error when he includes child care as a fixed annual expense for a family of four. As Horpedahl points out, full-time day care only lasts for a few years of each child’s life:
[T]he most important thing about childcare costs is that these are temporary costs, thank goodness. Most kids will only be in full-time daycare for a maximum of 5 years, so for a 2-child household this is 10 years of full-time daycare costs, or about $160,000 total over the kids’ younger years…It doesn’t make sense to put $32,773 into the permanent basic needs budget of a 2-child family, since it is a temporary expense. And it’s also wrong to say, as Green does, that the “second earner is working to pay the stranger watching their children so they can go to work and clear $1-2K extra a month.” The median [working woman] is making double the cost of daycare…And they are only bearing that full cost for 5 full calendar years, compared with a working career of perhaps 40 years of the second earner’s salary…Mr. Green is radically overstating the full impact of this choice on the household budget.
Mike’s cost calculations — and the MIT Living Wage Calculator, where he’s getting his numbers — assume that 16-year-olds are being put in full-time day care. That’s just wrong. Day care is more like college — a big but temporary one-time expense for each kid.2 (Also, as Horpedahl points out, a family earning $140k in New Jersey will qualify for tax credits to help pay for child care — something Mike doesn’t account for.)
But on top of all these mistakes, Mike’s whole methodology — and his whole concept of what “poverty” means — is just deeply flawed.
This is not how to think about poverty
First, let’s think about the food expenditure multiplier thing that Mike does.
When the economist Mollie Orshansky came up with the idea that poverty = 3x minimum food consumption back in 1963, she tried to base it on how much poor people were actually spending. She started by looking at how much it would take to buy a subsistence level of food — an amount of food that poor people would actually buy. She then used the 3x number to extrapolate how much poor people would spend overall.
What Mike does is completely different. He looks at how much middle-class people spend on food. In 1955, the percent of income that poor people and middle-class people spent on food was about the same. In the 2020s it is definitely not the same. Let’s look at that USDA chart again:
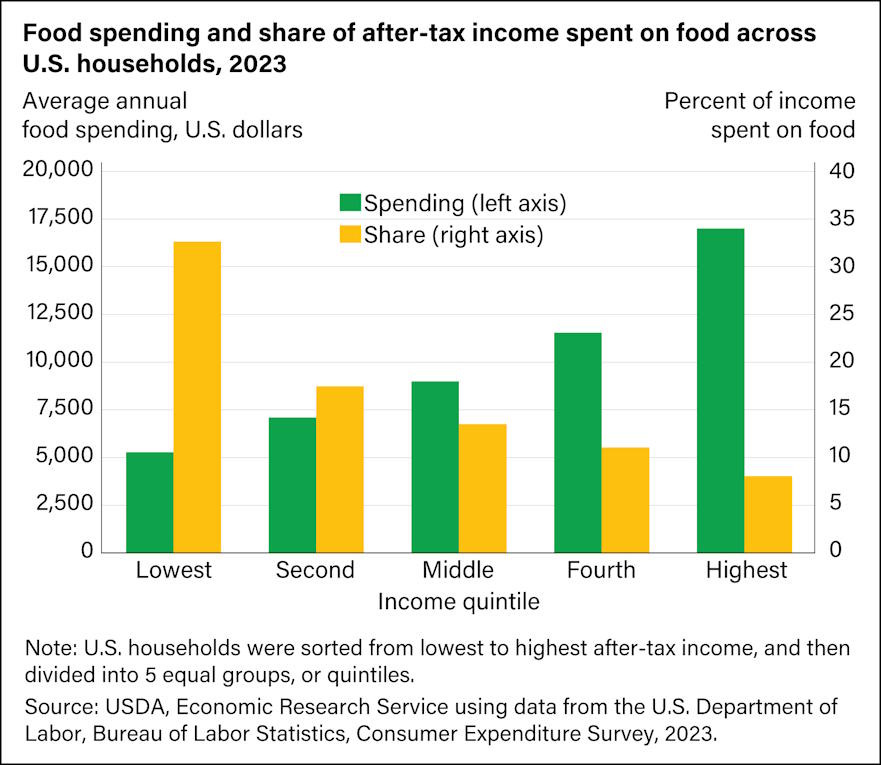
The poorest people in America are still spending a third of their income on food, just like in 1955! But instead of looking at what poor people do, Mike looks at the percent of their income that Americans in general spend on food. When he uses that number to extrapolate how much Americans need to spend on everything, he’s extrapolating to a lifestyle that’s middle-class by definition.
In other words, he’s assuming that a middle-class lifestyle is poverty.
As you can see from the chart above, food is what economists call an “inferior good” — there’s only so much you can eat, which is why rich Americans spend much less of their income on food. But Mike’s methodology assumes that if you spend less of your income on food, it must be because life’s other necessities got less affordable.
That doesn’t make sense, does it? Imagine Americans get so fabulously rich that they spend only 0.0001% of their income on food. The rest they spend on space vacations to the moons of Saturn, or modifying their genes to give them wings, or whatever. Mike Green’s methodology would have us multiply the cost of a 2000-calorie diet by one million, and label that as the “poverty line”. It makes no sense.
In fact, Mike’s other methodology for calculating the “poverty line” makes the exact same mistake. He gets his cost-of-living numbers from the MIT Living Wage Calculator. This project claims to only represent the cost of people’s “basic needs”, but when you look more closely, you see that its conception of “basic needs” includes some elements of middle-class comfort.
For example, Mike Green claims that his cost-of-living numbers only include “no vacations, no Netflix, no luxury”. But his “other essentials” category includes the Living Wage Calculator’s numbers for “Civic Engagement”, an $8,810 item that includes:
Entertainment: fees and admissions; Audio and visual equipment and services; Pets; Toys, hobbies, and playground equipment; Entertainment: other supplies, equip., & services; Reading; and Education
So…it does include Netflix. And in fact it includes many other things that make life nice and middle-class — hobbies, various forms of entertainment, and pets. I like all those things. I think everybody should have those things. But it’s odd to define the lack of these things as “poverty” in the sense that Mollie Orshansky defined poverty in 1963.
The “basic needs” that Mike and MIT expect everyone to afford are also a lot higher-quality than the equivalent stuff was back in 1963. Mike hand-waves this away:
Economists will look at my $140,000 figure and scream about “hedonic adjustments.” And yes, cars today have airbags, homes have air conditioning, and phones are supercomputers. The quality of many goods has gotten markedly better. But we are not calculating the price of luxury. We are calculating the price of participation.
But does this make any sense? Think about the increase in the size of homes, which we saw earlier with the floor space data. Those middle-class people in 1963 — the Teamsters with their good factory jobs and single income etc. etc. — aspired to buy new homes that were just 1,450 square feet. Today, that new house would be about 2,600 square feet. (And remember that families were larger then, too.)
Did Americans buy bigger houses because they were forced to? Did some nefarious fat cat in a smoky back room decide that now real estate companies would only make gigantic houses, in order to force Americans to pay more for floor space they didn’t really care about? Or did Americans want more space to themselves, and so as they got richer and richer over the years, they splurged on bigger houses?
In fact, this is the other consistent mistake that Mike Green makes — he assumes that whenever Americans pay more for something, it’s because they were forced to pay more, rather than that they got richer and were willing to buy more and better stuff. Because everyone needs a house and food and health insurance, Mike assumes that every dollar spent on those things is a dollar spent out of necessity — rather than a dollar voluntarily spent, in order to get a higher quality product.
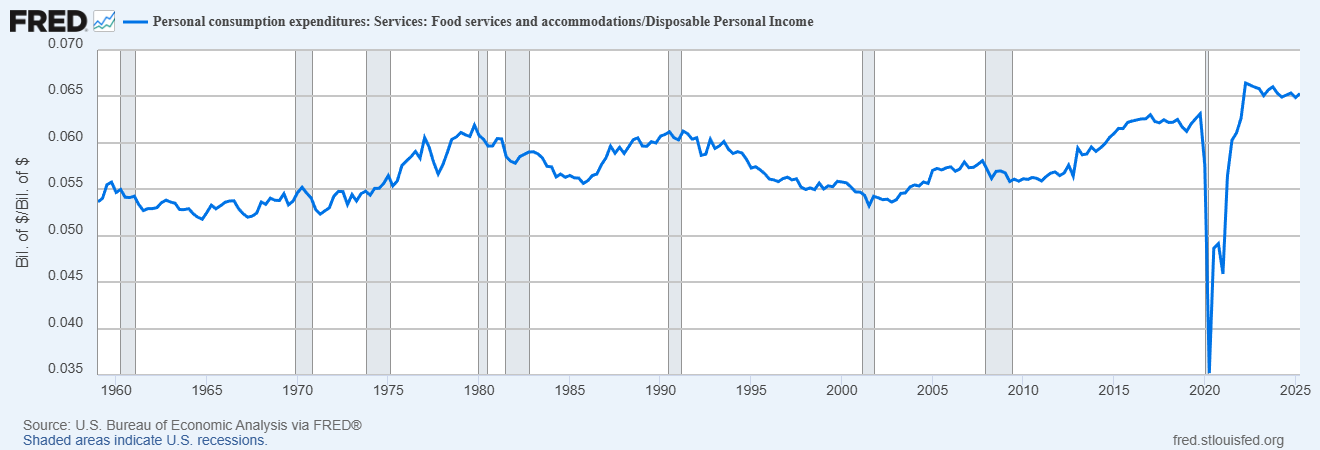
And yet when we look at overall patterns of American spending, this is just not what we see. We don’t just have to look at the “necessities” of life; we can also look at the non-necessities. For example, in the 60s, we spent 5.5% of our disposable income on restaurants; now we spend 6.5%:
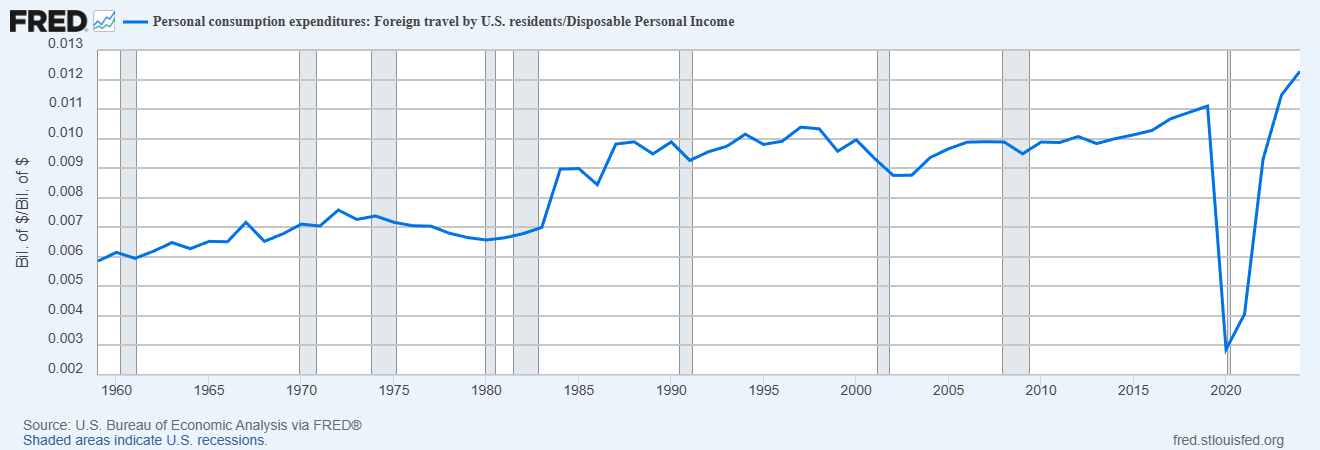
The percent of our income that we spend on foreign travel has doubled:
In fact it’s hard to think of a category of luxury consumption that Americans aren’t spending more on.3
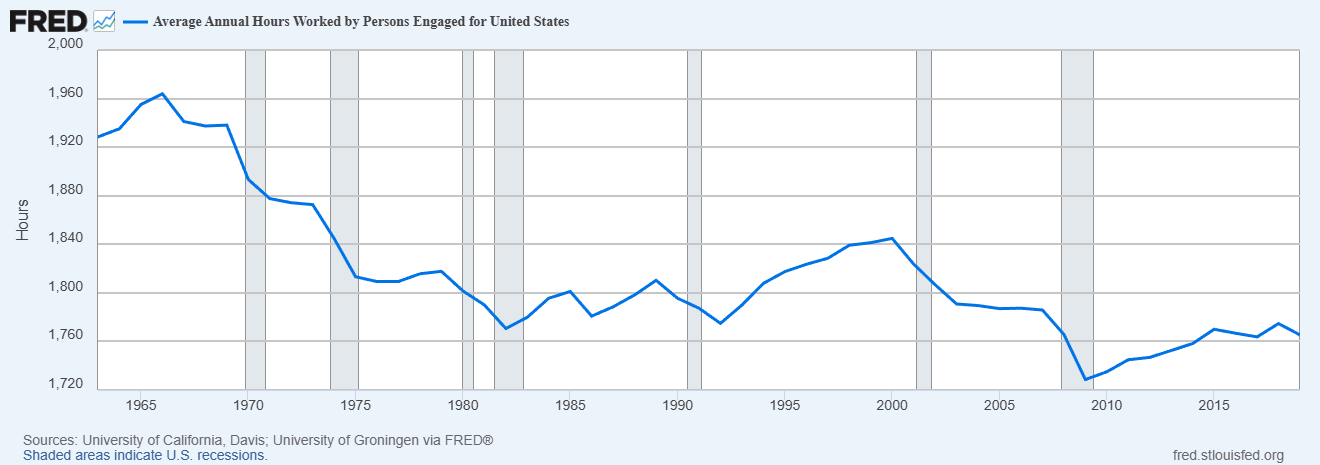
If American middle-class life were really a grim treadmill where even the basics of a “participation ticket” got further out of reach every year, then why are Americans flying to foreign countries, and going out to eat all the time? For that matter, why are they working fewer hours and taking more leisure every year:
In fact, when we look at overall luxury spending, we see that it’s risen since the 60s as a percent of what we spend:
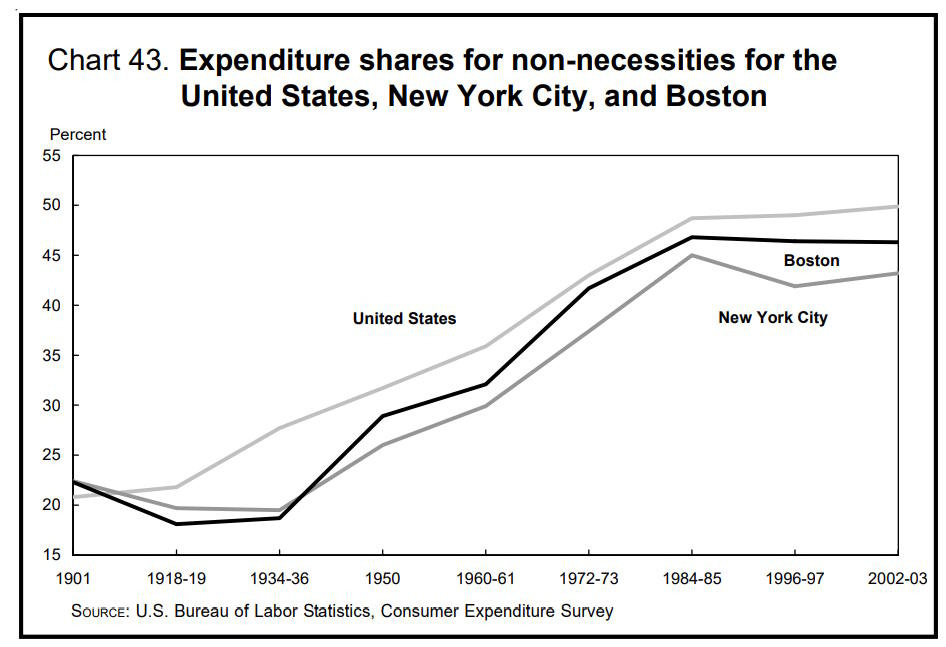
Luxury consumption plateaued or even shrank slightly in the Great Recession, but probably accelerated since the pandemic, as the numbers for restaurants and air travel suggest.
All this data adds up to one conclusion: Americans have gotten richer, so they’re spending more on living nicer lives. This includes both the “necessities” of life, like bigger houses, better MRIs, fancier food ingredients, and nicer cars, and also “luxuries” like foreign travel and restaurant meals. The “participation ticket” that Michael Green talks about isn’t a ticket out of poverty — it’s the chance to participate in an American middle class that enjoys a level of material luxury never before experienced by any middle class in any nation at any point in the history of the world.
Why do people want to believe that middle-class Americans are poor?
At this point I think I’ve done enough rebutting of Michael Green’s thesis that I’m allowed to start psychoanalyzing it — and, more importantly, psychoanalyzing the response to it. Why are so many people so desperately in love with the idea that the American middle class is poor?
First of all, everyone obviously wants to think that they’re struggling, downtrodden, and put-upon, so they can demand policy changes that favor themselves. That’s a normal, universal impulse. That’s why so many people hate the articles about how the $400,000-a-year class is struggling. Obviously not! It is I, the downtrodden peasant of only $140,000 a year, who is truly struggling, while the $400,000-a-year plutocrats lord it over us and steal all our hard-earned money with their corporate schemes!
And of course that means there’s also a political benefit to riling up the angry middle-class-masses. The middle class votes in large numbers, and they usually end up getting their way. Thus, no matter what ideology you’re pitching, it’s a good idea to tell them that they should be mad as hell, and that you’re the one who’s going to do something about it.
For foreign observers in Europe and the Anglosphere, there’s also an element of schadenfreude — and of cope. If you’re watching your country’s GDP fall behind America’s, it’s pleasant to think that America’s GDP is fake, and that all those higher incomes are being eaten up by the cost of a mere “participation ticket”.
But I think there are other explanations that aren’t so cynical. Michael Green is a very rich man, and to a very rich man, $140,000 probably does look like poverty. Wanting to help the middle-class masses be more comfortable and secure is not a bad impulse at all — it’s a form of noblesse oblige. And as American inequality has widened, every class sees someone far below them that they can feel noblesse oblige toward.
And there is real, justified anger over living costs in America. No, overpriced urban housing and health care and child care and college tuition haven’t made America’s middle class poor. But they’ve made Americans less rich than they ought to be. Most of the increase in costs came in earlier decades, and Americans are just now getting around to being mad. A little bit of exaggeration in service of that anger isn’t necessarily a terrible thing. Hopefully the rage can be turned against the regulatory and permitting regimes that are the real barrier to cheaper services, rather than diverted towards immigrants, tech companies, and other red herrings.
Here is an example of something silly that I wrote. Here is another example.
To be fair, the MIT Living Wage Calculator doesn’t include the cost of college, which adds a few more years of high costs for some families.
These are averages, but a few rich folks eating at Michelin Star restaurants and jet-setting to islands in the South Pacific can’t explain most of this.
“Did some nefarious fat cat in a smoky back room decide that now real estate companies would only make gigantic houses”
This exact thing happened in Auckland until a few years ago, but the culprit is not nefarious fat cats, it is zoning. If you have large areas with single housing zone, and with a minimum lot size that makes land cost at least the equivalent of half a million USD then of course you get large houses.
it's a service to debunk such sloppy analysis.
However, I think you did not present an accurate picture of food insecurity in the United States. The USDA report you linked to shows higher levels of food insecurity than you cite. Most readers will come away with the false impression that food insecurity is relatively rare.
I'm very involved in this issue on a grass roots basis and while practically no one in America is starved of food, the disruption to lives and loss of dignity of food uncertainty and having to rely on food banks and pantries is pervasive among the poor.