
Roundup #78: Roboliberalism
AI and productivity; Yuppie Fishtank Theory; Global development; American living standards; George Borjas


I kind of want to write about AI every day these days, but I’ve got to pace myself so you all don’t get overloaded. So here’s a roundup post with only one entry about AI. Just one, I promise!
Well, OK, there’s also a podcast episode about AI. I went on the truly excellent Justified Posteriors podcast to talk about the economics of AI with Andrey Fradkin and Seth Benzell. It was truly a joy to do a podcast with people who know economics at a deep level!

Anyway, on to this week’s roundup.
1. Did AI cause a productivity boom in 2025? We don’t know.
Erik Brynjolfsson believes that AI caused a productivity boom last year:
Data released this week offers a striking corrective to the narrative that AI has yet to have an impact on the US economy as a whole…[N]ew figures reveal that total payroll growth [in 2025] was revised downward by approximately 403,000 jobs. Crucially, this downward revision occurred while real GDP remained robust, including a 3.7 per cent growth rate in the fourth quarter. This decoupling — maintaining high output with significantly lower labour input — is the hallmark of productivity growth…My own updated analysis suggests a US productivity increase of roughly 2.7 per cent for 2025. This is a near doubling from the sluggish 1.4 per cent annual average that characterised the past decade…
Micro-level evidence further supports this structural shift. In our work on the employment effects of AI last year, Bharat Chandar, Ruyu Chen and I identified a cooling in entry-level hiring within AI-exposed sectors, where recruitment for junior roles declined by roughly 16 per cent while those who used AI to augment skills saw growing employment. This suggests companies are beginning to use AI for some codified, entry-level tasks.
But Martha Gimbel says not so fast:
There are three reasons why what we are seeing may not actually be a real jump in productivity—or an irreconcilable gap between economic growth and job growth…
First, productivity is noisy data…We shouldn’t overreact to one or even two quarters of data. Looking over several quarters, we can see that productivity growth has averaged about 2.2%. That is strong, but not unusually so…
Second…for GDP growth in 2025, we’re still waiting for [revisions to come in]. Note that any comparison of jobs data and GDP data for 2025 is comparing revised jobs data to unrevised and incomplete GDP data…
Third…GDP data has been weird in 2025 partly because of policy and behavioral swings around trade. If you look at job growth relative to private-domestic final purchases…[job growth] is still low, but not as low as it is relative to the GDP data…
[E]ven if you trust the productivity data…there are other explanations besides AI…One reason job growth in 2025 was so low was because of changes in immigration policy. If the people being removed from the labor force were lower productivity workers, that will show up as an increase in productivity even though the productivity of the workers who remain behind has not changed…
Second, if you look at the productivity data, it appears that much of the boost is coming from capital utilization due to increased productive investment…[A]t this point it is people investing in AI not people becoming more productive by using AI.
Meanwhile, in January, Alex Imas had a very good post about AI and productivity:

Alex gathers a bunch of studies showing that AI improves productivity in most tasks. But in the real world, productivity improvements from new technology famously come with a lag, as companies retool their business models around the new tech. For a while, productivity actually falls, then starts to rise once the new business models start working. This is called the productivity J-curve. Brynjolfsson thinks we’ve hit the rising part of the J-curve, but Alex thinks we haven’t:
At the macro level, these [micro] gains [from AI] have not yet convincingly shown up in aggregate productivity statistics. While some studies show a slow down in hiring for AI-exposed jobs—which suggests that individual workers are either becoming more productive or tasks are being automated—the extent and timing of these dynamics are currently being debated. Other studies have found no changes in hours worked or wages earned based on AI use.
Also, Brynjolfsson thinks that job loss in AI-exposed occupations is a sign of growing productivity. But that may not be the case; new technologies can grow productivity while increasing hiring, by creating new tasks for humans to do. A new survey by Yotzov et al. finds that although corporate executives in the U.S., Australia, and Germany expect AI to cut employment, employees themselves expect it to provide new job opportunities:
We survey almost 6000 CFOs, CEOs and executives from stratified firm samples across the US, UK, Germany and Australia…[A]round 70% of firms actively use AI…[F]irms report little impact of AI over the last 3 years, with over 80% of firms reporting no impact on either employment or productivity…[F]irms predict sizable impacts over the next 3 years, forecasting AI will boost productivity by 1.4%, increase output by 0.8% and cut employment by 0.7%. We also survey individual employees who predict a 0.5% increase in employment in the next 3 years as a result of AI. This contrast implies a sizable gap in expectations, with senior executives predicting reductions in employment from AI and employees predicting net job creation.
And a new study by Aldasoro et al. finds that in Europe, AI adoption seems to be increasing employment at the companies that adopt it:
Our results reveal three key findings. First, AI adoption causally increases labour productivity levels by 4% on average in the EU. This effect is statistically robust and economically meaningful…[T]he 4% gain suggests that AI acts in the short term as a complementary input that enhances efficiency…
Second, and crucially, we find no evidence that AI reduces employment in the short run. While naïve comparisons suggest AI-adopting firms employ more workers, this relationship disappears once we account for selection effects through our instrumental variable approach. The absence of negative employment effects, combined with significant productivity gains, points to a specific mechanism: capital deepening. AI augments worker output – enabling employees to complete tasks faster and make better decisions – without displacing labour. [emphasis mine]
Everyone seems to just assume that AI is a human-remover, and in some cases it is. But overall, it might actually turn out to be complementary to humans, like previous waves of technology; we just don’t know yet. The lesson here is that we don’t really know how technology affects productivity, growth, employment, etc. until we try it and see. The economy is a complex machine that reallocates a lot of stuff in very surprising ways.
So stay tuned…
Update: Here is a good chart from the excellent Greg Ip of the Wall Street Journal:
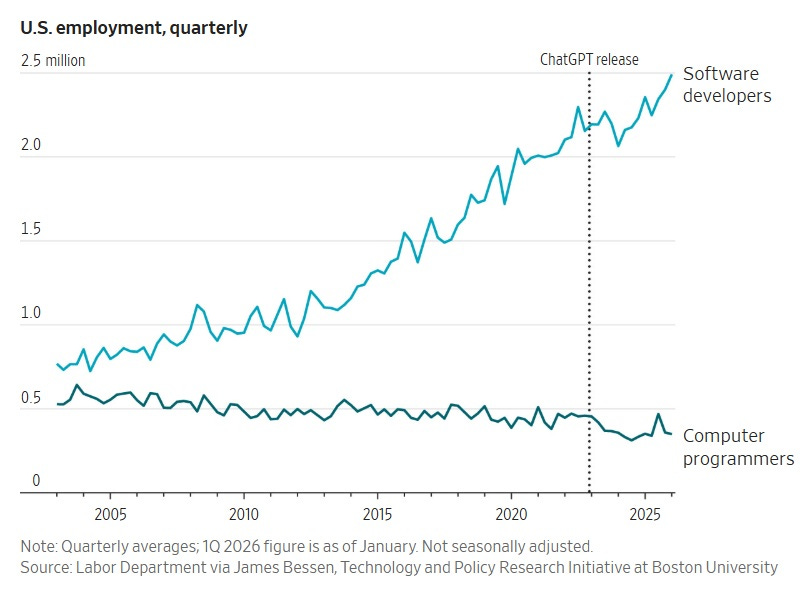
Also, for what it’s worth, here’s Goldman Sachs:


2. Yuppie Fishtank Theory wins again
One of the most fun posts I’ve ever written was about how building high-end housing can reduce rents for lower-income people. I called it “Yuppie Fishtank Theory”:

The basic idea is very simple: If you build nice shiny new places for high earners (“yuppies”), they won’t go try to take over the existing lower-cost housing stock and muscle out the working class.
This is important because a lot of people believe the exact opposite. They think that if you build new market-rate (“luxury”) housing in an area, it’ll attract rich people, cause gentrification, and raise rents.
Over the years, my theory has been proven right — and the “gentrification” theory has been proven wrong — again and again. Here was a roundup I did of the evidence back in 2024:

Now Henry Grabar flags some new evidence that says — surprise, surprise — that Yuppie Fishtank Theory is still true:
A new study lays out exactly how a brand-new building can open up more housing in other, lower-income areas, creating the conditions that enable prices to fall…
In the paper, three researchers looked in extraordinary detail at the effects of a new 43-story condo project in Honolulu…What the researchers found was that the new housing freed up older, cheaper apartments, which, in turn, became occupied by people leaving behind still-cheaper homes elsewhere in the city, and so on…The paper estimates the tower’s 512 units created at least 557 vacancies across the city—with some units…creating as many as four vacancies around town…
To figure this out, the researchers…traced buyers arriving at the new apartments back to their previous homes and then, in some cases, they traced the new occupants of those homes back to prior addresses. The study found that the Central’s new residents left behind houses and apartments that were, on average, 38 percent cheaper, per square foot, than the apartments they moved into.
Yuppie Fishtanks win again!
Cities that are applying Yuppie Fishtank Theory are seeing their rents fall. Here’s a Bloomberg story from December:
Rents got cheaper in several major cities this past year, thanks to an influx of luxury apartment buildings opening their doors and luring tenants to vacate their old homes…New building openings are bringing rents down as wealthy tenants trade up, forcing landlords to drop prices for older apartments. Rents for older units have fallen as much as 11%, and some are now on offer at rates as low as homes that are usually designated as “affordable”…The changed dynamic in the rental market is challenging the idea that luxury housing doesn’t help the broader ecosystem.
Overall, cities that build more housing are seeing lower rents:
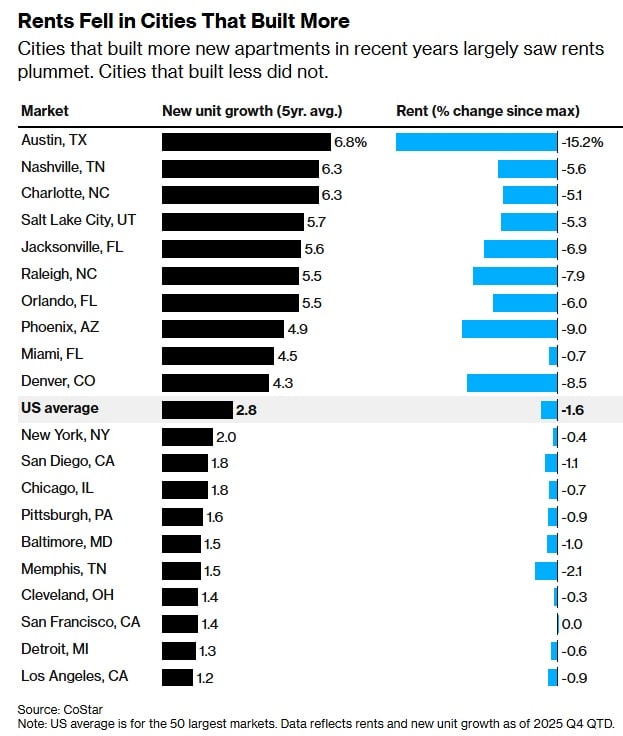
At this point, “building housing reduces rent” is as close to a scientific law of the housing market as we’re likely to find.
Build more housing!!
3. The “development is dead” people have a new reason for pessimism
Three years ago, David Oks and Henry Williams wrote a long post claiming that economic development was dead — that poor countries had done great in the post-WW2 decades when they sold raw materials to fast-growing rich countries, but that their growth in the 90s, 00s, and 10s was a bust. That was nonsense, and I wrote a lengthy rebuttal here:

Instead of rehashing that debate, I just want to link to Oks’ latest post, in which he expresses extreme pessimism about global poverty:
He cites a recent post by Max Roser of Our World in Data (the excellent site where I get many of the charts for this blog). Roser notes that extreme poverty — defined as the fraction of people living on less than $3 a day — has declined so much in South Asia, East Asia, and Latin America that it has basically vanished. This leaves Africa as the only region with an appreciable number of extremely poor people left (except for some parts of Central Asia). And since African poverty rates are not declining, and African population is growing much faster than population elsewhere, this means that the number of extremely poor people in the world is set to start rising again:
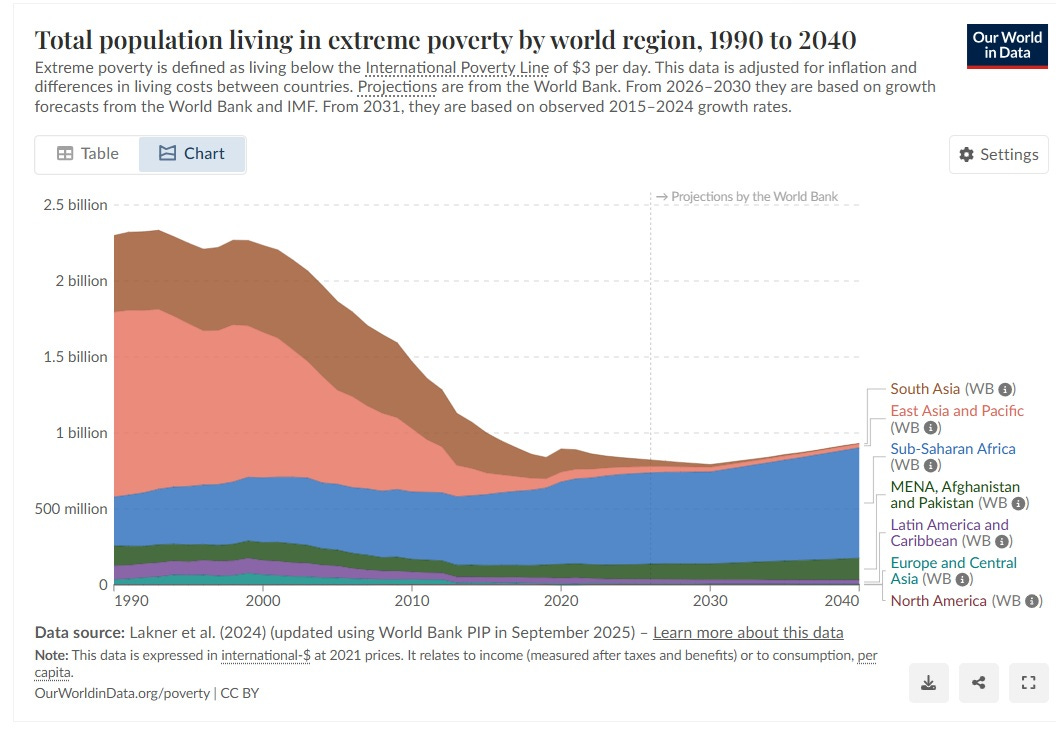
The first thing to note is that by using this chart, and by making this argument, David Oks directly contradicts his thesis from his 2023 article. In 2023, Oks argued that global development since 1990 had been disappointing; in his new post, Oks argues that poverty reduction in 1990-2024 everywhere outside of Africa was so incredibly successful that it basically went to completion and has nowhere left to go!
Oks’ old post was pessimistic about the entire developing world — South Asia, Latin America, Africa, and so on. In this new post, he retreats to pessimism about Africa alone. This is a significant retreat — it’s an implicit acknowledgement that development was very very real for the billions of poor people who lived outside Africa in 1990.
As for whether Oks is right about Africa, only time will tell. But note that the rising global poverty in the chart above is entirely a forecast. If African growth surprises on the upside — say, from solar power and AI — and African fertility falls faster than expected, then we could see Africa follow in the footsteps of the other regions.
Our goal should be to keep the pessimists embarrassed.
4. America is actually really really rich
On paper, the U.S. is a lot richer than most other rich countries — including Canada:
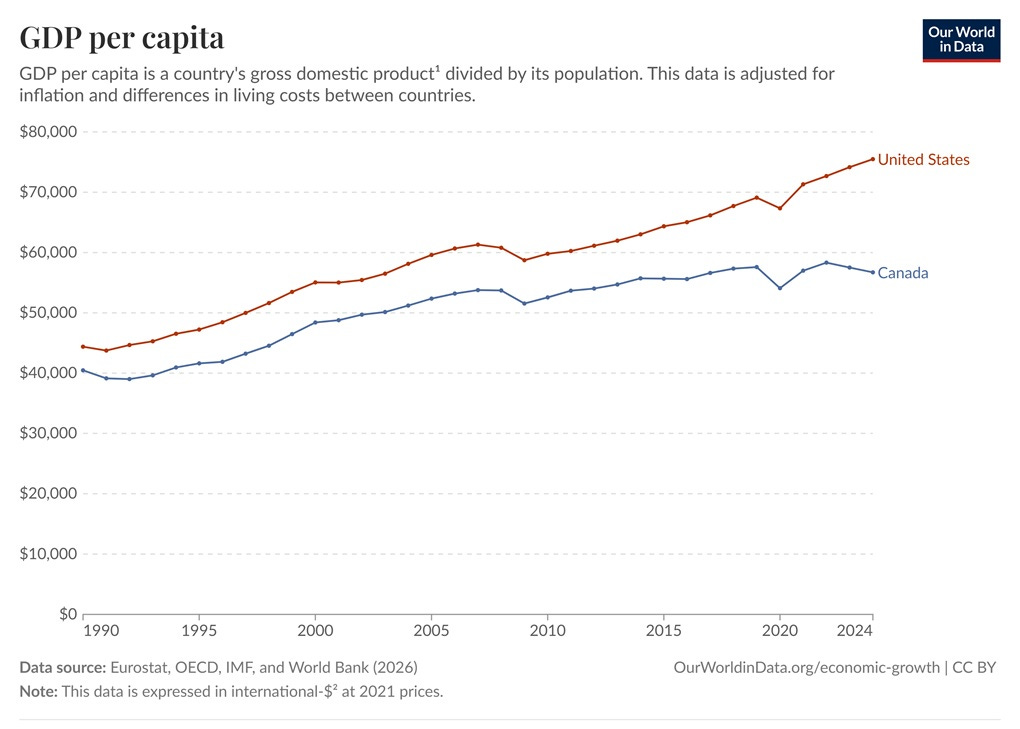
In terms of per capita GDP, Canada is poorer than Alabama, America’s poorest state. Canada is a little less unequal than America, so the difference in median incomes between the two countries is smaller — only about 18% higher as of 2021 (though the gap is growing). But that’s still a sizeable gap!
Europeans, Australians, and Canadians who visit America’s disorderly and crime-ridden city centers can sometimes balk at this fact. They instinctively start groping for some reason the numbers must be wrong. But reporters from Canada’s Globe and Mail traveled to Alabama, and discovered that the numbers don’t lie — America really is just a very, very rich place, even compared to other countries. Here are some excerpts from their article:
For eons, Canadians have viewed Alabama as a small state that, save for a few pockets, is dirt poor…For an ego check, The Globe and Mail travelled to the Deep South to understand how this happened. Immediately, it was obvious Alabama is misunderstood. In Huntsville, there are as many Subaru Outbacks as there are pickup trucks, and the geography in Alabama’s two largest metropolitan areas – Birmingham and Huntsville – looks nothing like the historical imagery…
Alabama is also home to five million people…and its economy is booming. The state’s unemployment rate is now just 2.7 per cent, versus 6.5 per cent in Canada, and its major employers include Airbus SE and giant defence contractor Northrop Grumman Corp. The state has also morphed into an auto manufacturing powerhouse with plants from Mercedes-Benz AG, Toyota Motor Corp., Hyundai Motor Co. and more. In 2024, Alabama made nearly as many vehicles as Ontario…
As for Birmingham itself, there’s the beauty of the rolling hills, which deliver stunning fall foliage. And the city’s becoming a foodie hub. A new restaurant, Bayonet, was named one of America’s 50 best restaurants by The New York Times last fall. And despite the bible thumping, Birmingham has a sizable LGBTQ+ community and scored the same as Boston on the Human Rights Campaign’s Municipal Equality Index.
The Globe and Mail article notes that Alabama has a higher poverty rate and lower life expectancy than Canada — and being a newspaper in a progressive country, it fails to mention the much higher crime rate. But the fact is, for most Alabamans, the material standard of living is more comfortable than what prevails in much of Canada.
People who believe America’s wealth is fake need to go there and see for themselves that it’s real.
5. Why friends don’t let friends cite George Borjas
In general, economists find that immigration’s economic effect on the native born is either positive or zero. But one famous economist, George Borjas, consistently finds negative effects. This makes Borjas beloved of the Trump administration and the nativist movement in general — it’s very common to hear MAGA people cite Borjas in debates.
It’s very odd that one economist keeps getting results about immigration that are so out of whack with what everyone else finds. Well, it turns out that if you look closely at George Borjas’ methodologies, you find a lot of dodgy stuff. I wrote about this several times back during the first Trump administration, when I worked for Bloomberg. Here’s what I wrote in 2015:
[I]n 2015, George Borjas…came out with a shocking claim -- the celebrated [David] Card result [about the Mariel Boatlift not harming American workers], he declared, was completely wrong. Borjas chose a different set of comparison [cities]…He also focused on a very specific subset of low-skilled Miami workers. Unlike Card, Borjas found that the Mariel boatlift immigration surge had a big negative effect on native wages for this vulnerable subgroup.
Now, in relatively short order, Borjas’ startling claim has been effectively debunked. Giovanni Peri and Vasil Yasenov, in a new National Bureau of Economic Research working paper…find that Borjas only got the result that he did by choosing a very narrow, specific set of Miami workers. Borjas ignores young workers and non-Cuban Hispanics -- two groups of workers who should have been among the most affected by competition from the Mariel immigrants. When these workers are added back in, the negative impact that Borjas finds disappears.
But it gets worse. Borjas was so careful in choosing his arbitrary comparison group that his sample of Miami workers was extremely tiny -- only 17 to 25 workers in total. That is way too small of a sample size to draw reliable conclusions. Peri and Yasenov find that when the sample is expanded from this tiny group, the supposed negative effect of immigration vanishes.
All of this leaves Borjas’ result looking very fishy.
And here was a follow-up in 2017:
Recently, Michael Clemens of the Center for Global Development and Jennifer Hunt of Rutgers University found an even bigger problem with Borjas’ study. Clemens and Hunt noted that in 1980, the same year as the Mariel boatlift, the U.S. Census Bureau changed its methods for counting black men with low levels of education. The workers that Borjas finds were hurt by the Mariel immigration include these black men. But because these workers generally have lower wages than those the Census had counted before, Borjas’ finding of a wage drop among this group, the authors claim, was almost certainly a result of the change in measurement.
And here’s what I wrote in 2016:
Borjas has written a book…called “Immigration Economics.”…However, University of California-Berkeley professor David Card and University of California-Davis’ Peri have written a paper critiquing the methods in Borjas’ book. It turns out that the way Borjas and the economists he cites do immigration economics is very, very different from the way other researchers do it.
One big difference is how economists measure the number of immigrants coming into a particular labor market…[I]nstead of using the change in the number of immigrants, Borjas just uses the number of immigrants itself…This creates a number of problems.
Let’s think about a simple example. Suppose there are 90 native-born landscapers in the city of Cleveland, and 10 immigrant landscapers. Suppose that demand for landscapers goes up, because people in Cleveland start buying houses with bigger lawns. That pushes up the wages of landscapers, which will draws 100 more native-born Clevelanders into the landscaping business. But the supply of immigrants is relatively fixed. So the percent of immigrants in the Cleveland landscaping business has gone down, from 10 percent to only 5 percent, even though the number of immigrants in the business has stayed the same.
Borjas will find that the percent of immigrants in the business goes down just as wages go up. But to conclude that native workers’ wages went up because immigration went down would be totally incorrect, because immigration didn’t actually fall! In fact, Borjas’ method is vulnerable to reaching exactly this sort of erroneous conclusion. Card and Peri point out that if you use the more sensible measure, there’s not much correlation between immigrant inflows and native-born workers’ wages and income mobility.
In other words, there’s a clear pattern of Borjas using strange and seemingly inferior methods, and arriving at conclusions that diverge radically from his peers. So I was not exactly surprised when Jiaxin He and Adam Ozimek looked at Borjas’ recent work on H-1B workers also contained some very dodgy methodology:
Borjas’s February 2026 working paper attempted to answer whether H-1B workers earn less than comparable native-born workers by combining data on actual H-1B earnings with American Community Survey data on native workers. The conclusions are negative, with H-1B holders earning 16 percent less. But these findings result from substantial data errors.
…The most significant mistake is a crucial temporal mismatch between his H-1B and native-born samples: the H-1B applications span 2020-2023, while the ACS data covers just 2023.
Nowhere did the paper mention controlling for inflation or wage growth. Given 15.1 percent inflation and an 18.7 percent wage increase for software occupations alone from 2020 to 2023, comparing wages of H-1B workers from 2020 to 2023 to… native-born wages from 2023 only produces negatively biased results that overstates the wage gap…A simple approach is to directly compare the 2023 H-1B observations (FY 2024) to 2023 ACS data. Alternatively, we can use all years but adjust for inflation and convert all years to real 2023 dollars. Both approaches cut the wage gap roughly in half…
The second error stems from controlling for geographic wage drivers using each worker’s PUMA (public use microdata area)…The problem is that Dr. Borjas uses the PUMA where visa holders work alongside the PUMA where native workers live. Consider a native-born software developer working at Google in Mountain View who resides in a cheaper area like Fremont. If residential areas have lower average wages than business districts, this mismatch systematically inflates the apparent native wage and negatively biases the H-1B wage gap.
Another Borjas paper with serious methodological errors, and an anti-immigration conclusion that disappears when you correct the errors? Shocking!
By this point, it should be clear that whether these mistakes are intentional or not, Borjas’ anti-immigration conclusions tend to vanish when the mistakes are corrected. Borjas is not a good source of information on immigration topics; every time someone cites him in a debate, you know they haven’t looked seriously at the literature.
Yes Noah the United States is rich. We are that rich, unhappy, dysfunctional family living in our own triangle of sadness.
Keeping up with AI? READ THIS DEEP DIVE on the Pentagon's bullying of Anthropic. How successful will the government be in enslaving smart people and demanding their intellectual cooperation?
https://www.ifyoucankeepit.org/cp/189341250