In which David Sacks and Balaji raise a false alarm about the jobs numbers
The government numbers are not fake. They're just noisy.
Today’s fun thing on Twitter was a couple of tech folks, venture capitalist and podcaster David Sacks and my old friend Balaji Srinivasan, claiming that the official jobs numbers are fake. Here is Sacks:
Many economists, such as Adam Ozimek and Joey Politano, jumped in to argue with them and defend the government job numbers. The tech folks fired back, and a good time was had by all.
To make a long story short, the economists are right and the tech folks don’t have a good picture of what’s going on here. Sacks is over-extrapolating from his own corner of the economy and misunderstanding what the job numbers say; Balaji is mistaking normal forecast errors and data revisions for bad data, and suspecting fraud where there is almost certainly none. The more mundane, pedestrian truth is that it’s just really hard to get accurate real-time data on something as complex as a country’s job market, which is why we shouldn’t put too much stock in any one month or even one quarter of data.
Anyway, here’s a more detailed explanation of what’s going on.
What the job numbers actually say
If you were the government, and you wanted to know how many people in America had a job, how would you do it? Well, you’d go ask. Specifically, there are two groups of people you could go ask:
You could go ask companies how many people they have on payroll.
You could go ask regular people whether they have a job or not.
In fact, the U.S. government does both of these things. The first is called the “payroll survey” or the “establishment survey”, and the second is called the “household survey”. In May, the payroll survey showed the U.S. economy adding over 300,000 jobs, while the household survey showed an increase in the unemployment rate that corresponds to a loss of about 300,000 jobs. That’s why Sacks thinks the data contradict each other.
But let’s think more carefully about those two ways of measuring jobs. If you think about it, you can immediately see that these two questions — “How many people do you have on payroll?”, and “Do you have a job?” — are measuring fundamentally different things. For example, imagine a self-employed freelance writer. Does she have a job? Yes. Is she on anyone’s payroll? No. So if you call up companies and ask “How many people do you have on payroll?”, that survey will miss all the self-employed people like her. But if you call up households and ask “Do you have a job?”, you’ll catch people like her.
It’s just a different concept of “employment”. Neither one is right or wrong; they just tell you two different things.
This explains the difference that David Sacks talks about. This month’s jobs report found that a bunch of wage and salary workers were added to payrolls in May, but a bunch of other people stopped being self-employed:
In May, companies added wage and salary workers. Unemployment rose because this addition was more than outweighed by a bunch of people saying they were no longer self-employed.
Self-employment is the biggest difference between the two surveys, but there are a few others. And when you adjust the household survey so that the definition of “employment” is the same as the definition in the payroll survey, you get a number that matches the payroll number very closely. Both show a monthly gain of about 300-400k in May.

Now you may be asking: Why make two different definitions of jobs in the first place? Why not just use the same definition of “employment” in both surveys, in order to avoid confusing people? The reason is that the household survey notoriously has a lot more statistical noise than the payroll survey. It’s just a lot easier to get good data from businesses than from calling people up at home. It’s also a lot easier to make sure you get a representative sample, so that you need fewer statistical assumptions.
So there’s a tradeoff here; the household survey gets a more complete picture of all the various types of employment (like self-employment), but the data is also much lower quality.
So which should you trust to give you the “right” numbers for May? In fact, we don’t know. The labor market might be weakening due to a bunch of self-employed people losing their livelihoods. Or that might have been a statistical sampling error, and the job market might still be strong, as the more reliable but less comprehensive payroll numbers suggest. It’s a mystery.
That doesn’t mean the numbers are “fake”, and it certainly doesn’t mean they’re being intentionally faked. It just means that this stuff is inherently hard to measure — the only way to include self-employment in the picture is to make your data a lot noisier. Which is why you shouldn’t pay too much attention to each month’s data release. Yes, a lot of journalists draw big conclusions every time the jobs numbers come out, but they shouldn’t.
(Also, if you think about it for two seconds, you’ll realize that if the government really wanted to intentionally fake its data, it wouldn’t release two mutually contradictory sets of numbers. It would release only one number or the other. This would be an incredibly dumb way to go about faking data.)
As a side note, Sacks also complained that the good jobs numbers are suspicious because all he sees are layoffs. But Sacks’ own corner of the economy just isn’t representative of the whole. Silicon Valley is out of sync with the rest of America; information technology employment has been pretty much flat in recent months, even as the rest of the economy expanded. In fact, the tech layoffs haven’t even been that big; a lot of it is just small cuts after huge over-hiring in 2020-21.
So that takes care of Sacks’ complaints; let’s move on to Balaji’s.
Forecasts, revisions, and methodological issues
In Balaji’s thread, he goes over a bunch of past examples where private-sector companies faked their data (Enron) or used bad models (credit rating agencies), and alleges that the U.S. government is doing the same now. As evidence he cites:
The aforementioned discrepancy between the payroll and household surveys,
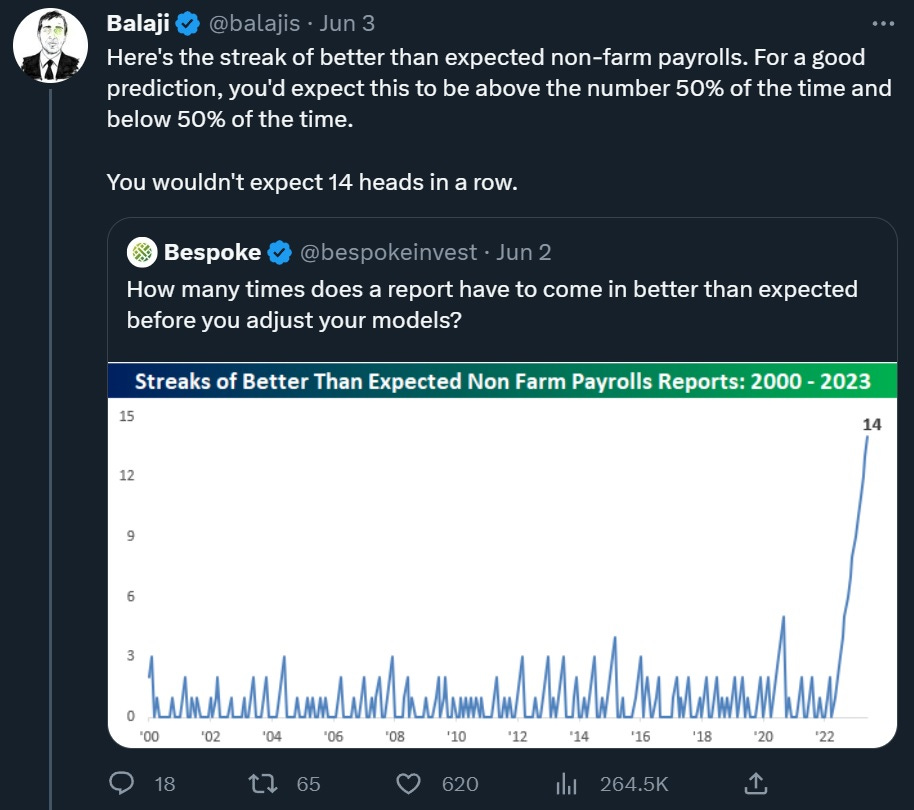
Forecasters making predictions of payroll growth that were too low for 14 months in a row,
Revisions to government numbers, and
Questionable assumptions in the statistical models used to create the payroll employment numbers.
We already talked about the first of these, so now let’s discuss the other three.
First, forecasts. Balaji notes that over the last year or more, forecasters have consistently underestimated how many jobs would be added to the payroll numbers:
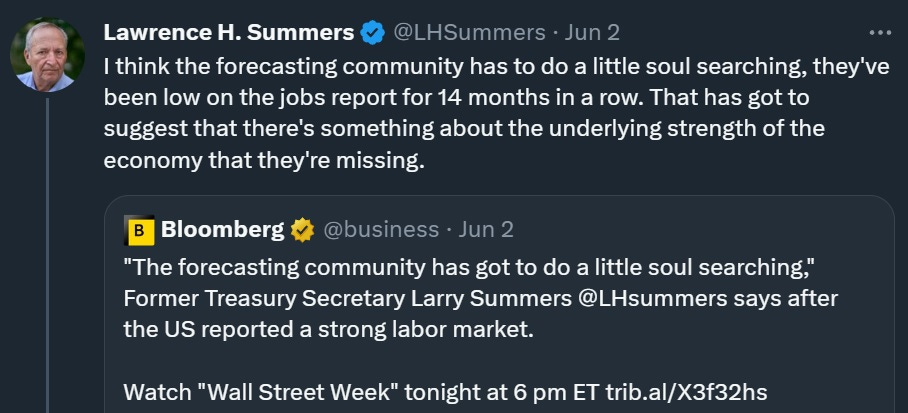
This is, indeed, some pretty crappy forecasting, as Larry Summers points out:
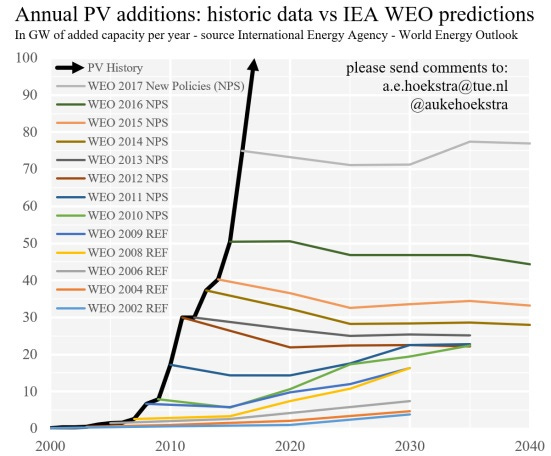
This kind of consistent forecasting failure is, unfortunately, pretty common out there in the world. Remember how the International Energy Agency got solar forecasts wrong year after year, and never updated its model?
Or remember how markets kept expecting the Fed to raise rates in the 2010s and it kept not happening? Unfortunately, forecasters have a tendency to get lazy and ignore the fact that the world has changed and their old models are broken.
That being said, bad forecasts are no reason to believe that the government numbers are fake. Forecasts are just predictions — and in this case, they’re macroeconomic predictions, which are notoriously unreliable. If macroeconomic predictions fail to match the data, you generally don’t assume there’s something wrong with the data. You assume there’s something wrong with the predictions. That’s what Summers concludes, and Balaji ought to be drawing the same conclusion.
Next, let’s talk about revisions. Balaji notes that government numbers are often subject to big revisions as new data comes in. He cites the account Wall Street Silver, who points out some big revisions to the wage numbers from the fourth quarter of 2022:
Now, Wall Street Silver is absolutely right to point out that news stories that drew big conclusions based on Q4 wage data were wrong. This is why journalists shouldn’t draw big conclusions from one monthly or quarterly data point. But Wall Street Silver is absolutely wrong to conclude that revisions mean that “all of the data has been faked”.
First of all, just think about this logically for two seconds. If you wanted to fake some data, would you come out with a revision a few months later showing a much different number? No, you would not. You would come out with a fake revision that matched your earlier fake data. Or you would just…not do a revision at all. Coming out with a revision that makes a major correction to your earlier numbers would be just about the dumbest method of fraud imaginable. So the accusation that “all of the data has been faked” just makes no sense whatsoever.
But anyway, revisions are real and important. It’s very hard to get good macroeconomic data in real time, so the BLS and other government agencies continue to collect data on past months and quarters and to revise their previous numbers. That is what an honest statistical agency does, instead of pretending that it gets the exact right numbers in real time.
And when we look at the monthly payroll revisions, we see that they’re typically pretty modest, on the order of tens of thousands. Here’s a table showing the revisions in 2022. A few months have big revisions, but most are pretty modest:

Also, although revisions tend to be biased upward in good times (i.e. more jobs added each month than the govt. initially thought) and downward in bad times, on average they’re pretty much unbiased:

This means that over time, the upward and downward revisions will tend to cancel each other out. So while revisions are a good reason not to put too much stock in any one month of data, they’re also not a reason to think the data is fake. The data is just very noisy.
You’ll notice that Japanese government macroeconomic data is notoriously volatile and subject to huge revisions, while Chinese government data is notoriously smooth. Now tell me whose government you think is more scrupulous and honest about data: China’s, or Japan’s.
OK, finally, let’s talk about methodological problems in the way the government constructs these numbers. The government can’t go ask every single company or every single household every month, like we do for the Census every 10 years. So instead it does statistical sampling. That will necessarily involve some statistical assumptions, because the sample isn’t going to be perfectly representative of all the companies and households out there.
Those statistical assumptions aren’t always the right ones — how could they be? But that doesn’t mean they constitute data fakery. If the government were trying to use bad assumptions to fake data, it’s unlikely that government economists would debate and criticize these assumptions openly and discuss ways to improve them.
Anyway, the specific assumption Balaji talks about is something called the “birth-death model”. If you’re calling up a sample of companies and asking them “How many people did you add to your payrolls”, you still have to know how many companies there are in total in order to get a total payroll estimate for the whole economy. And this is a big problem, because companies get created and destroyed every day. So you have to make a guess at how many companies are getting created or destroyed. That guess is called a “birth-death model”.
One difficulty in making a good birth-death model is that in expansions, more companies tend to get created, while in recessions, more companies tend to be destroyed. So a really good birth-death model needs to know if you’re in a recession or an expansion. But because nobody really knows how to forecast recessions, we don’t typically know if we’re in a recession or an expansion until a few months into it, at least. So birth-death models tend to make mistakes at turning points — when the economy is just starting to speed up or slow down.
A second problem is that since the pandemic, business formation and destruction has been behaving really weirdly. In the early post-pandemic period, business creation absolutely exploded; now, that explosion is cooling down. This is highly unusual behavior. And it’s making life harder for the government statisticians, since it forces them to make big, uncertain guesses about how to tweak their birth-death models in the face of all this weirdness.
Anyway, it’s pretty easy to make a guess about what’s going on here. In 2022, when most of the revisions were on the positive side, it was a sign that the birth-death model was underestimating new business formation. Now, with revisions tending to be negative in the last few months, the birth-death model is probably overestimating new business formation or underestimating business closures. In other words, the economy is probably at a turning point and the labor market is weakening somewhat. That’s what you’d expect from rate hikes and bank failures. But of course we don’t know this yet; as usual, we need to wait a few months to get a better idea of what really happened.
Absolutely none of this means that the jobs numbers are being faked. The difficulty of knowing how many companies are created and destroyed is just one more source of uncertainty — one more thing that the government statisticians need to make a guess about. But given the fact that all of this is very well-known and reported on in many mainstream news outlets and popular websites and debated in research papers, it’s just highly unreasonable to lob accusations of data manipulation. Instead, this is just one more reason why monthly or quarterly numbers shouldn’t lead us to jump to conclusions about the state of the economy.
What if the job market is doing worse than we think?
One final point deserves mentioning. Suppose Balaji were right, and the U.S. government were faking its data to paint an overly rosy picture of the employment situation. Or accept that Balaji is wrong, and the numbers aren’t being faked, but suppose that the government is making a mistake and the true employment numbers are lower. What would be the implication for inflation?
This would mean that inflation can be expected to go down. The reason, as Tyler Cowen and I both attempted to explain to Balaji a few months ago, is that weak aggregate demand is associated with lower inflation. If Fed rate hikes and bank failures have sent the U.S. economy towards recession, that means we can expect inflation to continue to fall, as consumers becoming less willing to pay high prices.
The reason Balaji doesn’t see that, I think, is that he thinks the U.S. economy is about to collapse, and he has a mental model of economic collapse as an inflationary event. He thinks of the U.S. situation as being similar to an emerging-market crisis, where money flees the country and the currency collapses, leading to high inflation and economic devastation. He probably believes that Americans are about to abandon the U.S. dollar for Bitcoin, much as investors in emerging markets tend to abandon local currencies for the U.S. dollar in a crisis. And he probably believes that lower-than-estimated U.S. jobs numbers are the first sign of the economic devastation.
That whole model of the economy is wrong. The U.S. is not like an emerging market — we don’t borrow in foreign currency, and the idea of people abandoning the dollar en masse for Bitcoin or any other alternative currency is just a scare story at this point. But it probably explains why Balaji is quick to look for signs of hidden economic weakness.
In any case, it’s good to scrutinize government statistics and methodology. But it’s not particularly constructive to throw allegations of fakery. In reality, macroeconomic data is just very hard to collect, and very prone to noise. The right approach is not to stop trusting the government — it’s to simply stop getting excited over each monthly number that comes out.


i worked with detailed goverment survey data on gdp, retail & consumption, household & employer jobs for 30 years.
noah gets it absolutely right: initial prints are noisy, updates are systematically produced using more info, and surveys rebenchmarked to periodic censuses.
so it's messy but honest, & probably as good as it gets. thx noah!
Thanks, this was helpful.
As a fellow tech guy, my hunch is Balaji and Sacks are operating from the tech perspective that nearly everything you care about in your app/service/etc can be measured consistently and in real time. And the need to go back and revise isn’t there. I can see how this could lead them to think there’s something wrong with government stats on something as noisy as employment.