At least five interesting things to start your week (#33)
TSMC Arizona back on track, drawing arrows on graphs, the downsides of inclusionary zoning, why people hate inflation, and interesting ideas about market power
Hey, folks! I’m back from Japan, and ready to blog!
First up, podcasts. This week I went on the Lost Debate podcast with Ravi Gupta to talk about various fun stuff — mostly immigration, but also AI/jobs and math education:
And on Econ 102, we did the third of our Economies Around The World series, where I give brief overviews of how various countries are doing economically right now. This episode was about Africa, Latin America, and the Middle East:
Anyway, on to this week’s list of interesting things:
1. TSMC is building its U.S. factory quickly after all!
For over a year, along with many other writers who follow industrial policy, I sounded the alarm that the much-trumpeted TSMC fab in Arizona was way behind schedule. Here’s The Economist in February of this year:
Last summer [TSMC] pushed back the start of production at the first of two plants it is building in Arizona from 2024 to 2025. In January it announced that a second plant, previously scheduled to open in 2026, would not be operational until 2027 or 2028. The second was meant to produce three-nanometre (nm) chips, the most advanced currently on the market, but TSMC has raised the prospect that it may now be used for less cutting-edge production.
Although an early kerfuffle between the company and local construction unions was solved in January, other big problems, including environmental review, seemed to loom large. In general this contributed to America’s image as the Build-Nothing Country, and raised some doubts about the Biden administration’s ability to follow through on its industrial policy goals. Some Republicans had picked up on the story and began using it as evidence of Biden’s incompetence.
Except…it turns out that all the news stories about the huge delays, including all the ones I cited in my hand-wringing posts, were wrong. The instant that the CHIPS Act handed TSMC its $5 billion in subsidies, the company suddenly declared that the Arizona plant is ahead of schedule and will begin operating later this year:
Three months after TSMC announced further delays at its $40 billion Arizona fabs, the chip manufacturer has now said the plant is expected to be operating at full capacity by the end of [2024].
The announcement comes several weeks after it was first reported that TSMC is set to be awarded more than $5 billion in federal grants under the US CHIPS and Science Act…
Now, according to a report from the Chinese news outlet money.udn, TSMC is expecting to begin pilot production operations by mid-April, with the preparations for mass production to be completed by the end of the year. It is unclear whether both fabs or just the 4nm facility are now due to be in production ahead of schedule.
OOOOOPS!!! So much for that whole story. Assuming this report is confirmed, it appears that the delays were intentional sandbagging by TSMC in order to make sure it secured its CHIPS Act money. As soon as the check was safely in the mail, the company started going full steam ahead.
There are a few lessons here. First of all, news stories are often wrong and are subject to rapid revision, and we always need to be prepared to adjust our beliefs quickly as new information comes in.
Second of all, industrial policy involves a very complex and often adversarial dance between companies and governments, full of bluffs, counter-bluffs, backroom struggles, last-minute deals, and credit-hogging after the fact. This is nothing new — if you read books about the World War 2 production effort like Destructive Creation, you’ll see lots of similar anecdotes.
Finally, industrial policy is a learning process, especially for a government that isn’t used to doing it. It’s not the kind of policy that immediately achieves demonstrable, dramatic, uniformly positive results on day one. It’s a process of exploration, adjustment, and recalibration, and it involves lots of mistakes and blind alleys. It’s possible for it to fail, but it’s not the kind of thing where you can immediately know whether it’ll ultimately be a success or a failure. The opposition party will always have the urge to jump on any apparent setback for political reasons, and sometimes they’ll even be right. But those of us pundits who strongly value objectivity have no choice but to watch and wait.
(Update: Actually TSMC is building three U.S. fabs, and getting $11 billion total in subsidies! Here is the big announcement from TSMC.)
2. Arrows on charts can be misleading
John Burn-Murdoch of the Financial Times has — quite deservedly — become known as the top Chart Guy in economics journalism. Week after week, he comes out with beautiful, easy-to-read charts that almost always show some dramatic and important trend. Once in a while he cites some questionable data, and once in a while he makes a small error in data presentation, but such oversights are rare — on the whole his work is truly excellent, and he deserves the attention and acclaim he has received.
But there is one thing that he does when making his charts that I want to call attention to, because I think it can be a little misleading. Sometimes he represents the last data point on a chart not as a dot, but as an arrow. For example, here’s a chart about racial realignment in U.S. politics:
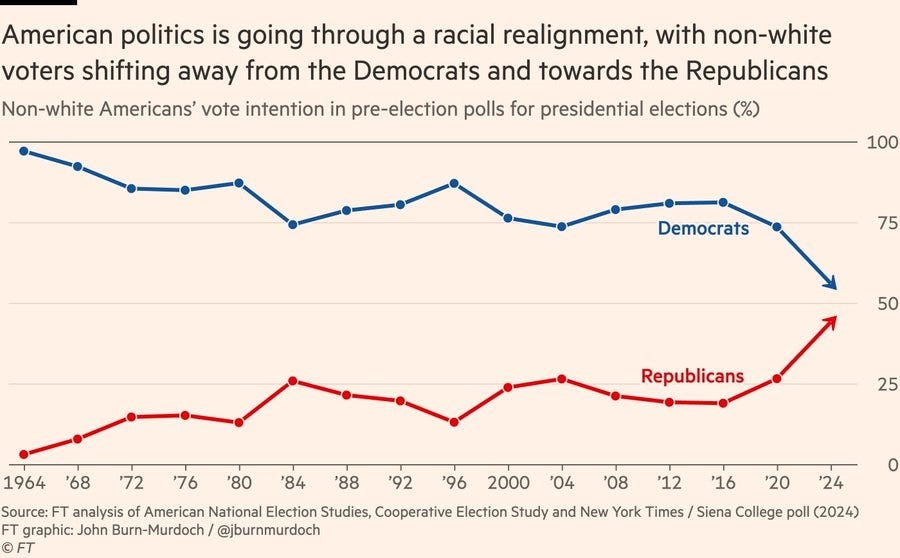
Now, this is a generally great graph: It’s easy to understand, it shows the whole relevant part of the y-axis, etc. But the final data points on the two time series (“time series” is econ-speak for “line on a chart”) are depicted as arrows instead of as dots like all the other data points. Those arrows indicate the direction of a trend — specifically, they indicate the direction of the four-year change from 2020 to 2024. They’re a visual suggestion that the direction of the last four years is the way things are headed in the future.
But are they? If you look at the whole graph, you can see that nonwhite voters have become a little less Democratic and a little more Republican since 1964, but there are definitely ups and downs there. From 1984 to 1996, or from 2004 to 2016, it even looked like the trend was going in the other direction! Eventually, those proved to be short-term fluctuations.
But the big jump from 2020 to 2024 might turn out to be a temporary fluctuation as well. It could just be a temporary Trump effect or a backlash to a temporary spike in violent crime. It could be mismeasurement, due to polling getting less accurate. The arrow is making a prediction that the last four years are a trend instead of a blip, and that might not be right.
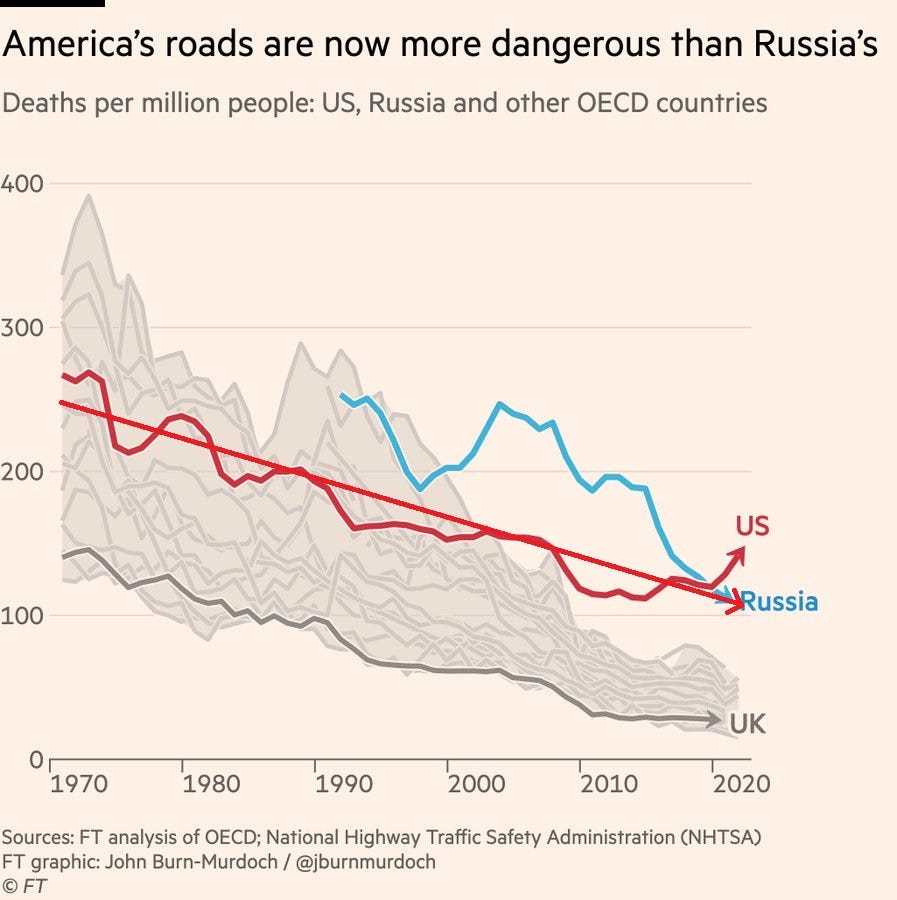
Here’s another example that I think makes the point even more clearly. About a week ago, John wrote a thread showing that U.S. road safety is lagging behind other countries. It included the following chart:
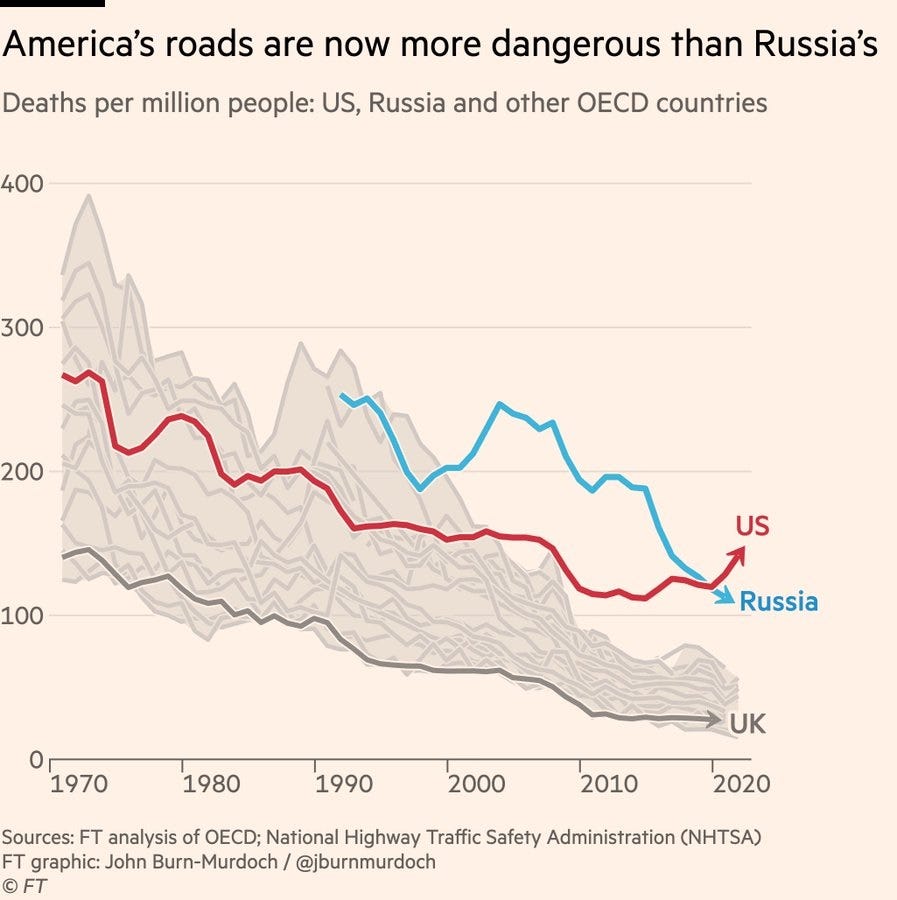
The arrow at the end of the U.S. time-series indicates a steeply rising trend — it implies that U.S. road deaths are skyrocketing. But unlike the previous example, this arrow represents only the last one or two years of change. That’s a very short-term trend! If we look at the longer-term trend, it would look something like this:
Now that looks like a very different story. The long-term trend shows U.S. traffic deaths decreasing, but at a slower rate than in most other countries.
Is there a reason to think that U.S. road safety turned a corner in 2020, and that the rise from 2019-2021 represents a new normal, where traffic deaths go up every year? It seems possible, but unlikely. More likely is that like homicide or other negative trends, the spike in road deaths was a temporary effect of the pandemic and/or the unrest of 2020. In fact, U.S. traffic deaths fell in 2022 and 2023:
U.S. traffic deaths fell 3.6% [in 2023]…according to full-year estimates by safety regulators…The National Highway Traffic Safety Administration said it was the second year in a row that fatalities decreased. The agency also released final numbers for 2022 on Monday, saying that 42,514 people died in crashes…NHTSA Deputy Administrator Sophie Shulman said that traffic deaths declined in the fourth quarter of [2023], marking the seventh straight quarterly drop that started with the second quarter of 2022…The declines come even though people are driving more.
So traffic deaths in the U.S. have been falling for almost two years now. The upward trend indicated by the arrow on John’s graph is misleading. The basic story that traffic deaths are too high is right, but the arrow suggests a crisis that just doesn’t actually seem to be happening.
So when you make charts, think very carefully before putting arrows on the ends of time series. Econometricians and statisticians have a whole lot of ways of estimating the trend of a time series, and as far as I know, none of them involve taking the direction of change between the two most recent data points and assuming that that’s the current trend.
3. Inclusionary zoning is a poison pill to kill housing construction
Economics is useful because it can often alert us to unintended consequences. For example, rent control seems like a good way to make rent cheaper, but it can end up reducing housing supply, thus shutting new renters out of the market entirely.
Another example is “inclusionary zoning” (or “IZ” for short). IZ is a policy that mandates that any new housing development has to set aside some percent of units to be “below market rate” (“BMR”) or “extremely low income” (“ELI”). This means that the landlord has to rent these units out at a cheap price, often to people who can prove that they have low income. So if you have inclusionary zoning at 20%, it means that 20% of the units in any new apartment building have to be rented out for cheap.
This is basically forcing developers/landlords to subsidize those units. This has some perverse consequences. First, it forces the developers/landlords raise rents for the rest of the units, in order to make up what they lose on the below-market-rate units. So average renters see their rent go up as a result of IZ. Second, even with those compensating rent increases, IZ makes development less profitable, so it discourages developers from building new housing at all. That can reduce supply, driving rents up throughout a city.
Shane Phillips of UCLA has a new report for the Terner Center in which he models these effects, using a tool called the Terner Housing Policy Simulator that calculates how likely developers are to build a certain project given certain parameters. He finds that Inclusionary Zoning has really big negative effects:
[W]hile IZ has been shown to produce BMR housing, it is also sometimes associated with reduced overall housing production and increased rents and/or house prices…
As the IZ requirement rises, there are diminishing returns to BMR production and accelerating losses to overall housing production. Beyond a certain level, higher IZ requirements produce less BMR and less market-rate housing…
[And] even small increases in rent growth in the unrestricted rental market would be enough to negate the value of private IZ subsidies…
The fact that poorly calibrated IZ policies could lead to reduced housing production and higher rents and housing prices— or both—should prompt caution about increasing IZ requirements…[E]ven well-designed IZ policies have limits, and producing BMR units through IZ may have more costs than benefits.
Phillips also has a thread in which he explains his results and shows the following simulation graph:
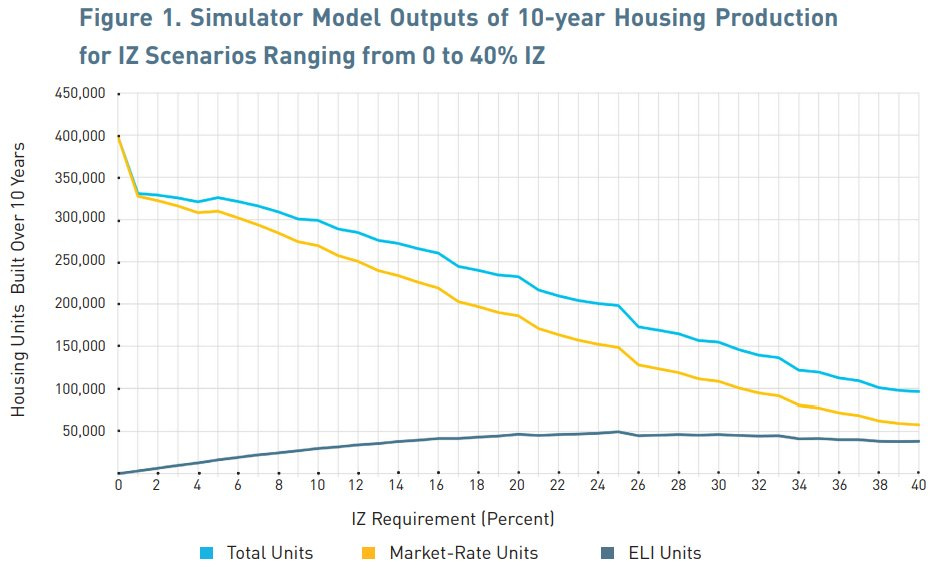
This shows that even a small IZ requirement can absolutely devastate market-rate housing construction. And once you go past 20% IZ, you’re basically screwed — going higher just kills housing supply without even creating any more below-market-rate units for poor people to live in.
In other words, IZ is basically a poison pill for housing development. The implication, as Phillips writes, is that in order to make housing as a whole more affordable, we should focus more on A) removing barriers to building market-rate housing, and B) using public money to subsidize rent for poor people. The latter policy will raise rents a bit, but it won’t hurt supply, and it’ll help poor folks get housing.
Sounds like great advice to me.
4. New evidence on why people hate inflation
Three years ago, I wrote a post called “Why do people hate inflation?”
My theory, drawing on survey research from the 1990s by Robert Shiller, was that it was all about sticky upward nominal wages — when inflation hits, workers ought to get accelerated wage increases, but they can’t, so their real wages end up falling. This is consistent with America’s experience in the 70s and in 2021-22.
Anyway, Stefanie Stantcheva has a new paper that strongly supports this theory. From the abstract:
Why do we dislike inflation? I conducted two surveys on representative samples of the US population to elicit people’s perceptions about the impacts of inflation and their reactions to it. The predominant reason for people’s aversion to inflation is the widespread belief that it diminishes their buying power, as neither personal nor general wage increases seem to match the pace of rising prices. As a result, respondents report having to make costly adjustments in their budgets and behaviors, especially among lower-income groups.
And from the body of the paper:
If there is a single and simple answer to the question “Why do we dislike inflation,” it is because many individuals feel that it systematically erodes their purchasing power. Many people do not perceive their wage increases sufficiently to keep up with inflation rates, and they often believe that wages tend to rise at a much slower rate compared to prices…In response to the perceived erosion of purchasing power, respondents report having to make costly and significant adjustments to their consumer behavior, such as reducing the quantity and quality of goods purchased or deferring purchases.
This is just the same thing that Shiller (1997) found. People feel that their raises can’t keep up with inflation, so inflation makes them poorer.
It is no great mystery as to why becoming poorer would make people upset.
But Stantcheva also uncovers a few other interesting new tidbits. For example, it looks like there’s some self-serving attribution bias going on. Even when inflation does cause people’s wages to go up faster, people attribute those wage increases to their own skill and job performance:
This perception of diminished living standards due to inflation is intensified by the observation that individuals rarely ascribe the raises they receive during inflationary periods to adjustments for inflation. Rather, they attribute these increases to job performance or career progression[.]
So suppose that inflation makes everyone’s wages go up 10% and prices go up 10% as well. People will think that the wage increase was due to their own skill, but the price increases were due to inflation. So they’ll think that if there had been no inflation, they would still have gotten that 10% raise, but prices would be much lower.
In other words, it might not even matter whether wages are sticky or not. Even if they’re not sticky — even if inflation pushes up wages and prices at the same rate — people might still think inflation is making them poorer.
Stantcheva also finds that people think high-earners are hit less by inflation than low earners:
Another factor contributing to the aversion towards inflation is a sense of unfairness…[T]here is a common belief that the incomes of higher-earning individuals increase more quickly than theirs during periods of inflation, suggesting a perception that inflation exacerbates inequality.
In fact, the opposite was true during the recent inflation in 2021-22. High earners got hit much worse than low earners!
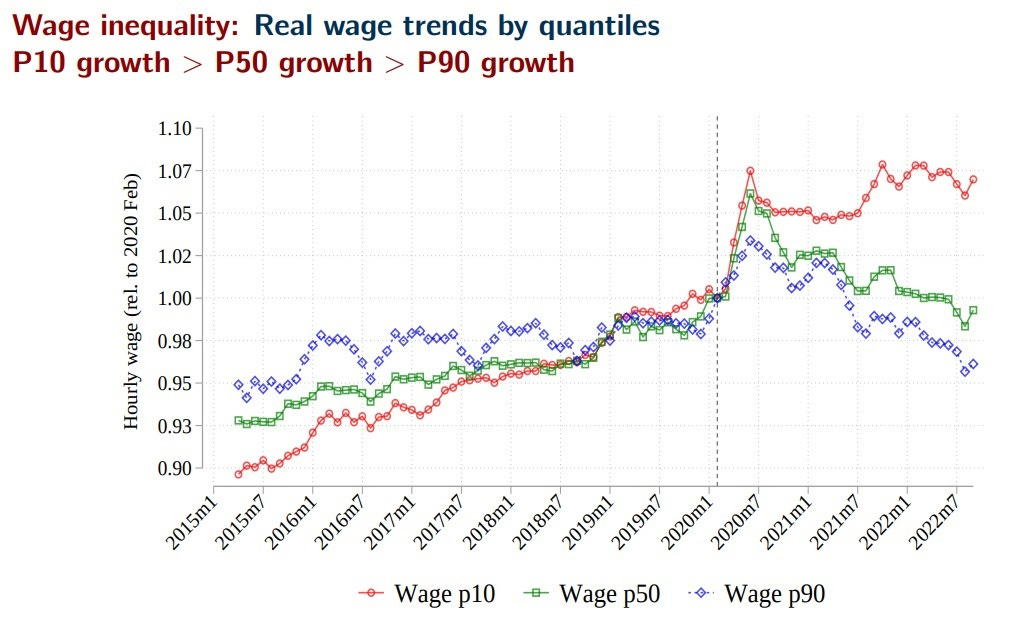
Stantcheva’s survey shows that we can probably expect people at all wage levels to get angry about inflation, even if they’re among the group that was far less hurt by it.
This should send a message to the Biden administration. Making sure inflation stays low, and people know inflation is staying low, is very important for making the American people happy.
5. Some new theories of market power
One of the big debates of the 2010s was about market power. A number of prominent research papers implicated corporate concentration, monopoly, monopsony, and rising markups in a variety of social and economic ills. That debate isn’t settled yet, but it raises a second important question, which is: Why did market power rise? The most common answer is “weaker antitrust”, but there are a lot of other possibilities.
Recently I came across an interesting paper about regulation and market power, by Shikhar Singla (2023):
This paper uses machine learning on regulatory documents to construct a novel dataset on compliance costs to examine the effect of regulations on market power. The dataset is comprehensive and consists of all significant regulations at the 6-digit NAICS level from 1970-2018. We find that regulatory costs have increased by $1 trillion during this period. We document that an increase in regulatory costs results in lower (higher) sales, employment, markups, and profitability for small (large) firms. Regulation driven increase in concentration is associated with lower elasticity of entry with respect to Tobin's Q, [and] lower productivity and investment after the late 1990s. We estimate that increased regulations can explain 31-37% of the rise in market power.
Basically, the idea here is that if it costs a lot of money to jump through regulatory hoops, only big companies will be able to pay that cost. Thus, big companies will survive, and flourish, and become more profitable due to lack of competition, while small businesses wither and die.
Here’s the author’s estimate of regulatory costs:
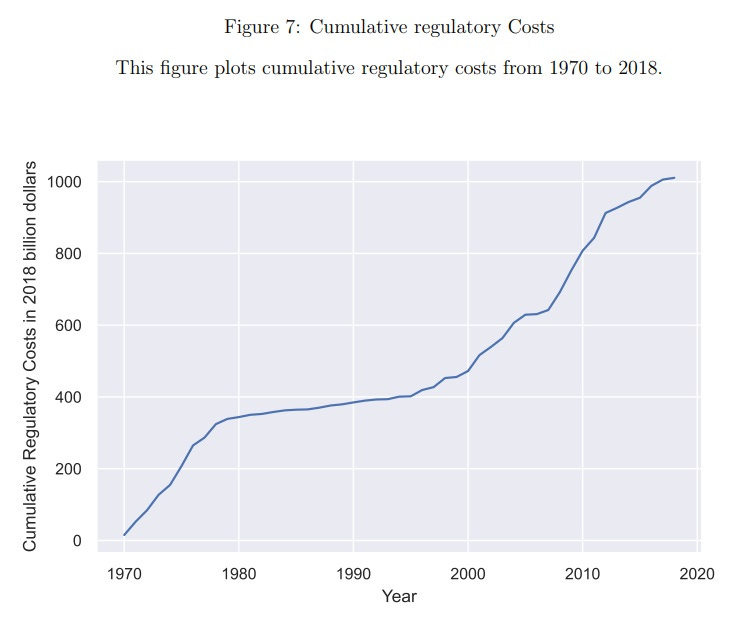
Now, I’m a little suspicious of this methodology, given that I can’t really tell how it works, and it’s outside of my own knowledge base — it’s sort of a black box of machine learning, combined with some assumptions taken from organizations that study regulatory costs. Also, although the post-2000 increase in market power lines up very nicely with the estimated increase in regulatory costs, most researchers think market power went down in the 70s and didn’t really increase during the 80s. So that doesn’t seem to line up with the massive increase in costs that Singla finds.
But anyway, it’s an interesting paper, and deserves some follow-up. And it’s an important reminder that well-meaning regulations can end up accidentally stacking the economic deck in favor of megacorporations who can afford to jump through all the hoops.
Another interesting recent paper is by Cho and Williams (2024). It’s a theory paper about how two powerful companies can effectively collude to act like a monopoly, even if they can’t communicate with each other in any way. From the abstract:
We develop a model of algorithmic pricing which shuts down every channel for explicit or implicit collusion, and yet still generates collusive outcomes. We analyze the dynamics of a duopoly market where both firms use pricing algorithms…The firms…adapt endogenously to market outcomes. We show that the market experiences recurrent episodes where both firms set prices at collusive levels….Our results show that collusive outcomes may be a recurrent feature of algorithmic environments with complementarities and endogenous adaptation, providing a challenge for competition policy.
Remember how Adam Smith said that when businesspeople get together, they always try to figure out how to collude to rig the market? Well, Cho and Williams show that maybe they don’t even need to get together to collude — they just need to observe each other’s prices and react in ways that create the effect of collusion. Presumably if there were 3 or 4 or 5 companies in the market, they could do something similar, though it would be harder.
This raises the question of whether the rise of the internet since the 1990s is contributing to market power. The internet allows companies to observe each other’s prices very easily, even automatically. Perhaps this allowed more de facto collusion? It’s something worth looking into, at any rate.
Anyway, what these papers show is that there are a lot of possible reasons for increased market power, beyond just the standard assumption that weaker antitrust is responsible. It seems like an important area of research.





You write that "well-meaning regulations can end up accidentally stacking the economic deck in favor of megacorporations" but this idea has been around for a long time, so why continue to assume that the effect is accidental. A more reasonable assumption might be that the motivating force behind most new regulation is precisely to stack the economic deck.
There’s something else going on with inflation. Loss aversion. Since retreated gains and losses differently, a 10% increase in your wages is nice, a 10% increase in the grocery bill is disastrous.