What the Solow Model can teach us about China
Economists knew back in the 1950s that a country can't build its way to infinite wealth.
The economist Robert Solow died this week, at the age of 99. He was a giant in his field, reshaping macroeconomics in a million ways that we take for granted today. Although he did work in numerous important areas, his most famous contribution by far — and the one for which he won the Nobel — was the Solow model of economic growth. So today, in honor of his passing, I wanted to talk a little about how the Solow model helps explain what we’ve seen happen to China’s economy over the last few decades, and especially in the last couple of years.
The question of why economies grow, and why they stop growing, is perhaps the most important in all of economics. It’s also an incredibly difficult question, both because growth is such a complicated thing, and because it’s very hard to compare different countries’ experiences. The Solow model is an incredibly simple thing — so simple that a bright junior high school student can learn it. It has only a few variables and a few parameters. There’s no possible way that such a simple model can tell us most of what we need to know about how and why economies grow.
And yet the amazing thing about the Solow model is that it does tell us a few incredibly important things about growth. As I see it, the two key lessons are:
Eventually, building more physical capital stops making your economy grow.
It’s possible to build so much physical capital that you make your people poor.
Those are incredibly important lessons, so first I thought I’d go through the basics of how we get those conclusions from Solow’s model. If you want a more complete intro to the model, check out the excellent series of videos by Alex Tabarrok and the folks at Marginal Revolution University:
I’ll try to sketch out the basics here. The Solow model assumes that economic output — also called “production” or “GDP” — comes from three things:
Labor (human work effort)
Physical capital (machines, buildings, vehicles, etc.)
A mysterious quantity called “total factor productivity” (TFP), usually abbreviated as “A”, which some people associate with technology
The Solow model deals mostly with the question of how physical capital affects growth. Physical capital is everything you can build that helps you build other stuff or create economic value. It includes machine tools, factories, office buildings, delivery vans, highways, port infrastructure, trains, and so on. In my mind, the easiest type of physical capital to imagine is a machine tool — a sewing machine, or a drill press, or a lathe, or a nanolithography machine. So I’ll usually use machine tools as my examples of physical capital. It made sense to think a lot about physical capital back in the 1950s when Solow created his model, since that was a time when developed economies and communist economies were both making big investments in factories, infrastructure, and so on.
Solow’s model makes three very reasonable assumptions about how physical capital works. It assumes:
You can build more physical capital by saving and investing.
Physical capital depreciates over time (at a constant rate).
On its own, physical capital has diminishing returns.
The first of these assumptions is actually the most subtle. The basic intuition is that you can set aside a certain amount of your GDP every year to build physical capital — like a farmer choosing to reserve a certain percentage of the annual corn harvest as seed corn for planting next year’s crop. But most real types of physical capital don’t work like seed corn — a sewing machine can’t be used to create new sewing machines, etc. So what Solow is actually assuming is that we set aside a certain percent of our financial income and use it to pay people to build more capital. It basically assumes a market where sewing machines, and any kind of capital, can be constructed for a price.
The second and third assumptions are pretty straightforward. If you’ve ever owned a car or a house, you know that it needs regular maintenance, upkeep, and renovation over time. If you have an economy with a lot of capital, some portion of it wears out every year and has to be replaced. (In the Solow model, the portion that wears out every year is just some constant percentage — 5% or 7% or whatever.) Replacing or maintaining your old worn-out capital costs money.
Finally, on its own, capital has diminishing returns. That means if you hold the number of people constant, eventually building more machines and buildings and such won’t help you produce more. To see why, just imagine one person trying to operate 100 sewing machines at once. They definitely wouldn’t produce 100 times as much as one person operating one sewing machine!
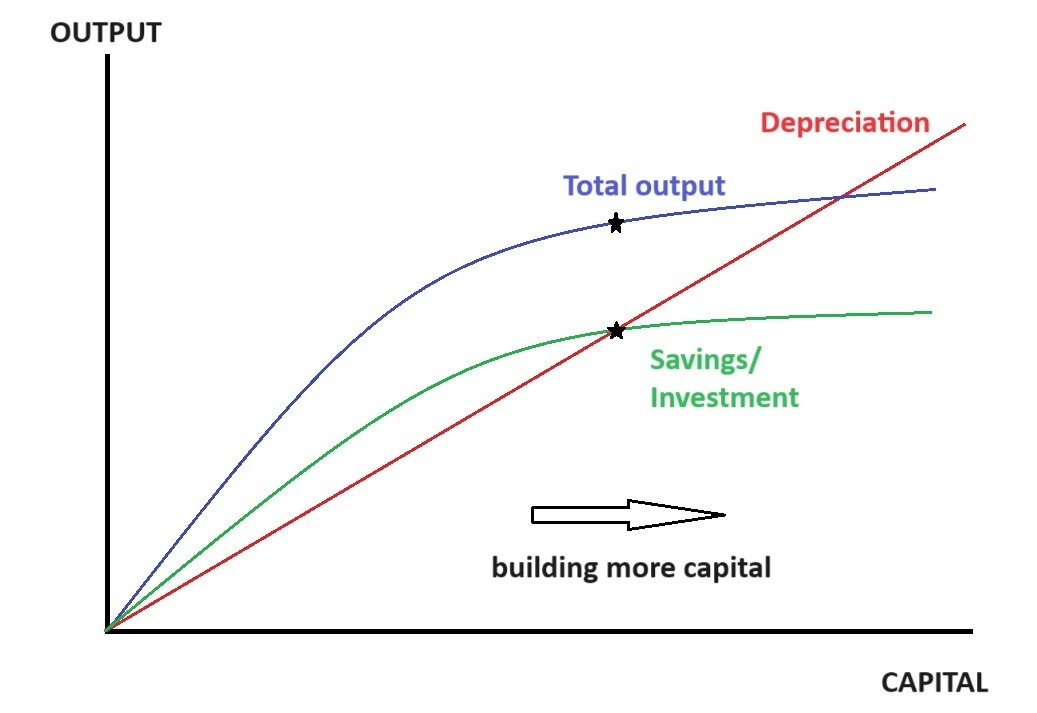
Anyway, if you make these three assumptions about how physical capital works, you can draw a whole lot of conclusions about how it affects economic growth. Suppose we hold the number of workers constant. In that case, the relationship between physical capital and economic output looks like this:
The red line represents how much capital depreciates every year. It’s a straight line because depreciation just depends on how much capital you have. If you have 10 times as much capital, then 10 times as much is depreciating every year.
The blue line is how much total economic output gets produced. As I said before, when the number of people is fixed, building more physical capital has diminishing returns. That’s why the curve is concave — each piece of capital you add gives you a little less additional output than the previous one.
The green line is how much production goes into building new capital. The Solow model assumes that a country saves and invests a constant fraction of its output. So the green line is just the fraction of output that gets invested — i.e, the fraction that gets plowed back into either building new capital or maintaining old capital. This has diminishing returns too, since investment has to come from output. That’s why the green line is curved like the blue line.
So what do these lines tell us? Well, the place where the green line crosses the red line — which I marked with a star — is an equilibrium of sorts. That’s the point where the amount of new capital coming into the economy via investment is the same as the amount of old capital going out of the economy via depreciation. It’s like homeostasis in biology. That’s the level of capital where the economy in this model eventually comes to rest. And the point right above it on the blue line (which I also marked with a star) is how much economic output actually gets produced at this level of capital.
(As a side note, I’ve ignored labor here by assuming it was fixed. But if you assume it grows at some rate, you can do the above graph in per capita terms, and you get the same result — an amount of capital per worker that eventually hits an equilibrium.)
So what does this tell us about how economies grow? It tells us one incredibly important thing. It tells us that because of depreciation and diminishing returns, a country simply can’t build its way to infinitely high standards of living. If you just keep trying to build more and more, at some point depreciation overwhelms you. and you just can’t build any more!
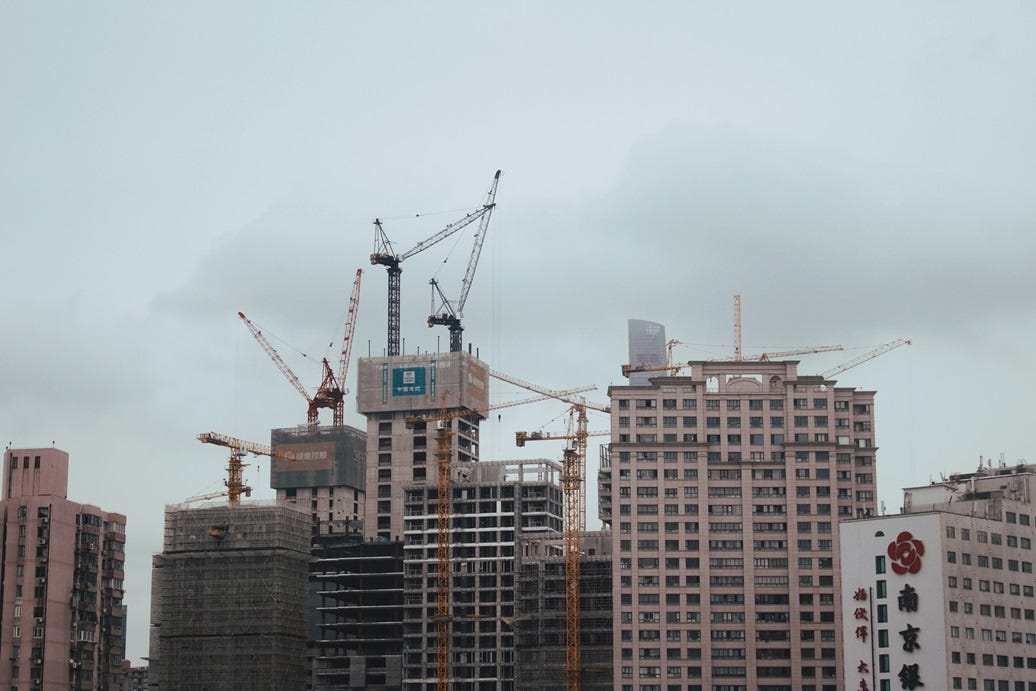
Let’s think about that in the context of China. Over the last four decades, China has built an absolutely incredible amount of physical capital — in absolute terms, the most any country has ever built in history. Think about the vast, sprawling factories filled with robots and machines, the forests of skyscrapers and apartment buildings, the rivers of highways and high speed rail, the fleets of cars and trucks and buses and ships and planes.
The Solow model gives a simple explanation for how China was able to build this much, this fast: It had a very high rate of savings and investment, far higher even than other Asian countries.
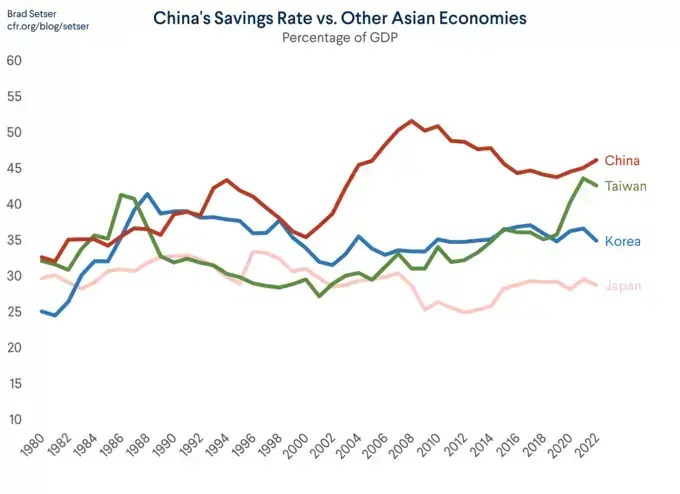
China dedicated everything it had to building massive amounts of physical capital, leaving relatively little of its economic output left over for its people’s consumption. As a result, it grew very very quickly.
But the Solow model says that this type of growth has a limit. Just as the model would predict, China started hitting diminishing returns. We started seeing “ghost cities” and massive overcapacity in all sorts of industrial sectors. China’s incremental capital-output ratio — the dollars of capital needed in order to generate an additional dollar of GDP — rose relentlessly from around 2007.
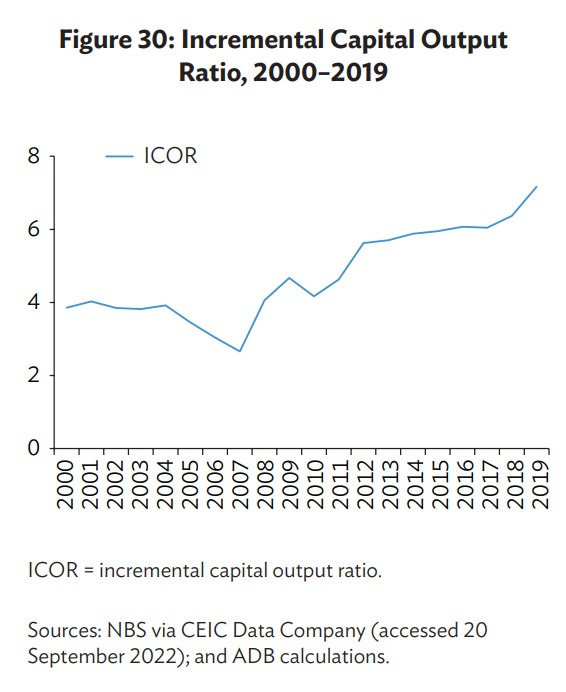
This is exactly the kind of diminishing returns the Solow model talks about.
On top of that, there’s depreciation to deal with. When you build that many apartment towers and highways and office buildings, you’re eventually going to have to maintain them. This is especially true of China, which tends to build things using cheap materials that don’t last very long. And when you build that many machine tools and vehicles, you’re going to have to work very hard just to replace them all as they age.
China is already probably struggling with capital depreciation. But it’s likely that the Solow model’s assumption of a constant rate of depreciation is only true in the long run, and that in the early days of a country’s building spree it’s not that much of a problem — you have to wait 20 or 30 years for all that shiny new stuff to start falling apart. So the depreciation of the massive capital stock China has built since the 1990s will probably be a bigger drag on growth in the years to come.
And just as the Solow model foretold, China’s growth is slowing:
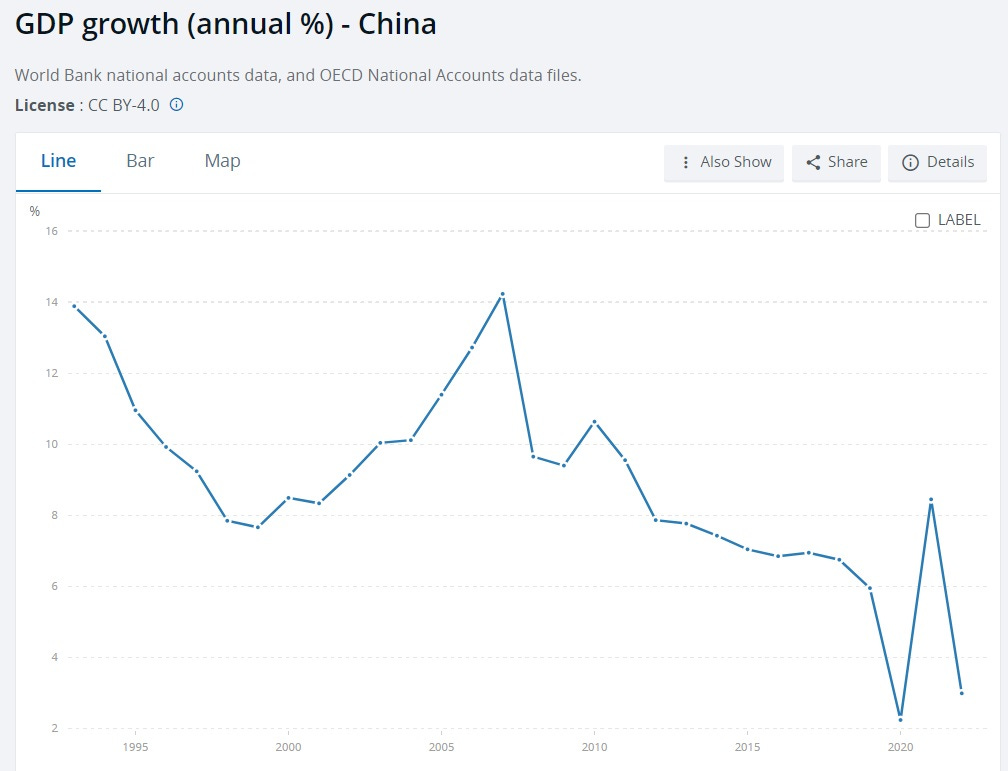
Slowing growth from physical capital accumulation is the Solow model’s first big insight. The second is that it’s actually possible for a country to save and invest so much of its income, and build so much physical capital, that it actually makes its citizens poorer.
The reason is, again, depreciation. If you save and invest a huge fraction of your income — as China has done — you will build an enormous amount of physical capital. But the more you build, the more you have to pay to upkeep in the future. There’s a point called the “golden rule”, above which saving and investing more of your national income just forces your citizens to forego more and more consumption in order to stave off capital depreciation.
Does China save and invest more than Solow’s “golden rule” would suggest? It’s hard to tell. But if any country is above the healthy limit, it’s China. Note that in the Solow model, the optimal savings rate is lower if population growth is lower; China’s population is now shrinking, and its working-age population is falling rapidly. So the Solow model serves as a warning to China’s leaders that they should consider encouraging their people to consume more.
So even though it’s a simplistic theory — almost a toy model, really — the Solow model can tell us a lot about the biggest and most important economic growth story of modern history. The basic lesson is that the usefulness of building sprees like China’s has a sell-by date. Eventually, physical capital accumulation stops being able to grow your economy, and can even backfire by reducing living standards. It’s a lesson China’s leaders, and companies considering investing in China, would do well to heed.
Of course, there is a vast amount that the Solow model can’t tell us about economic growth. Most of those unanswered questions are contained in that innocuous little letter “A”; as one of Solow’s contemporaries put it, total factor productivity is a measure of our ignorance. One factor exacerbating China’s growth slowdown is that TFP growth has slowed relentlessly over the last three decades:
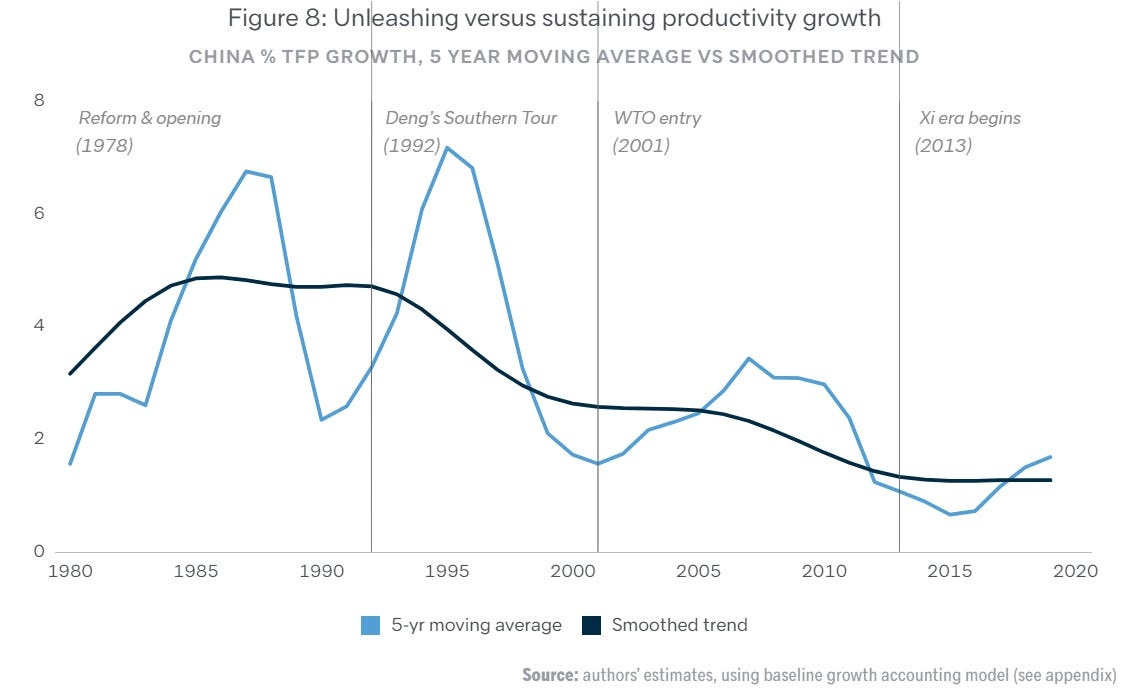
As of right now, China’s income is less than a third of the U.S.’ If China’s growth slows down to developed-country levels while only reaching 1/3 of rich-world living standards, it will represent a major failure for the country’s economic system.
But anyway, that is a story for another day — one that goes far beyond the bounds of the humble Solow model. Solow was a genius, and he helped us understand a lot about economic miracles, but there is much about the wealth of nations that has yet to be explained.


My central takeaway from learning the Solow growth model as an undergrad was not the limits of investment but the idea that long term, sustainable growth depends ultimately on “total factor productivity” growth, which is most easily thought of as exogenous technology improvements.
In my mind, China didn’t grow its economy over the last two decades just been building a lot of physical capital but also by copying technology left and right. It will continue to do so. Meanwhile, it is now publishing more technical papers than the US and is innovating in its own right. Solow’s model would predict much more growth to come for China.
Weirdly, I learned this in grade school playing Sid Meier's Alpha Centauri. It also teaches that this same lesson applies to both military forces and territorial expansion: "more stuff" means more expenses, and expanding *anything* too far eventually exceeds your ability to economically support it. That game was genuinely quite a teaching tool.